What will determine the outcome of the economic “protracted war” between China and the U.S.?

China and the U.S. have come to a 90-day trade agreement. This was a clear victory in the first battle of the “trade war” for China - as was admitted even in the U.S. media. As Bloomberg, a fiercely anti-China source, summarised the analysis of the overwhelming majority of Western media: “Xi Jinping’s decision to stand his ground against Donald Trump could hardly have gone any better for the Chinese leader.”
But it would be an error to mistake this decisive victory for China in the first battle with a belief that the U.S. will abandon the economic struggle against China – it will not. This is in economic terms a “protracted war” not a single battle. This article, therefore, analyses the precise situation of the U.S. economy as it entered the first battle of the tariff war and what forces will determine the outcome of this “protracted” economic war.
Introduction
In determining the outcome of the “tariff war” between the U.S. and China by far, the most important issue is China’s own development – nothing can substitute for China’s own success. However, it is also significant, particularly for specific questions of strategy and tactics, to understand the dynamic of the U.S. economy.
Regarding this issue with the U.S., it will be seen below that two issues are particularly important.
First, it is necessary to accurately understand the dynamics and timescale of the present struggle launched by the U.S. against China. Some articles in the media present the situation of the U.S. economy in what will be termed a “manic depressive” form. That is, if in the past there were greatly exaggerated reports of rapid growth/boom in the U.S. economy, there are now exaggerated reports of problems/crises in it. This exaggerated significance given to short-term ups and downs in the U.S. economy, a “manic-depressive” analysis, leads to a false perspective of the present U.S. clashing with China, as though it may have a quick outcome. The analysis below shows why this is false. In particular, in the same way that past claims of a great “boom” in the U.S. economy were false, while a sudden extremely deep recession/crisis in the U.S. economy, to the point where it rapidly and decisively lost the economic conflict with China, cannot be totally excluded, it has a low probability of occurring. Therefore, it would be a serious mistake to rest strategies and tactics on such outcomes. Instead, in English, there is an appropriate saying for this situation in that it is “a marathon and not a sprint” – among traditional Chinese sayings, a near equivalent would be “It takes a long time for water to wear away a stone”. The fundamental perspective should be that of a long drawn out, a “protracted” struggle - as a recent widely commented on article in Beijing Daily “Today, it is necessary to reread ‘On Protracted War’“noted. The present article, from an economic viewpoint, arrives at the same conclusion as that overall strategic analysis.
Second, because this struggle will be protracted, it is necessary to understand the most powerful long-term driving forces of the U.S. economy, as opposed to those that may affect short-term fluctuations. It will be seen that these are the same for China’s economy. It is, therefore, these fundamental issues which will determine the outcome of the economic “protracted war”.
To deal with these issues this article is in two parts.
1. First, what U.S. financial markets reveal about the real situation of the U.S. economy as it enters the tariff war against China.
2. Second, what the facts show are the most powerful driving forces of the U.S. and Chinese economies that will determine the outcome of the protracted struggle?
Part 1 – What U.S. market trends show about the situation of the U.S. economy as it entered the tariff war
“Manic-depressive” analyses of the U.S. economy
Following Trump’s introduction of tariffs, the U.S. media has recently been going through one of its typical periods of “manic depressive” analyses of the U.S. economy. That is, it is taking short-term up and down fluctuations, illegitimately extrapolating these into medium/long-term trends, thereby claiming that there are great at “booms” or the threat of deep “crises” in the U.S. economy.
It is therefore necessary to understand the actual reality. In fact, all that has occurred in fundamental terms so far in response to Trump’s introduction of tariffs is that the U.S. economy has continued a long-term gradual slowdown – the fluctuations that have taken place within the U.S. economy so far since Trump’s tariff announcements do not go outside the normal range of business cycle variations. The present article, therefore, intends to clarify what has, in various quarters, become an exaggerated discussion regarding prospects for the U.S. economy.
The present author, In numerous previous articles, has repeatedly shown - and in some circles has been criticized for stressing - why in the recent years it has been necessary not to exaggerate claims of “boom” in the U.S. economy. Now, it is equally necessary to show why claims of “crisis” in the U.S. economy must not be exaggerated.
In reality, neither “optimism” nor “pessimism” regarding the U.S. economy. or any other economy has virtue. The only position that has virtue is “realism.” In the past it was necessary to criticize exaggerated estimates of the U.S. economic “boom” not for the reason to spread “optimism” about China, or to make people feel better, or to be “polite” to China, but because such claims were untrue. Today, it is necessary to criticize exaggerated estimates of problems in the U.S. economy not in order to be “pessimistic” about U.S. competition with China - the author is not, but because such exaggerated estimates are untrue. Only an accurate analysis of this situation is useful. Therefore, it is necessary to understand why what has occurred so far in the US economy and financial markets in response to Trump’s tariffs does not exceed the scope of business cycle fluctuations.
Manic-depressive analysis in the U.S. media
To take some examples of the type of “depressive” analysis which was made in the U.S. media following Trump’s “reciprocal tariff” announcements on 2 April the Wall Street Journal’s article analysing this situation on 4 April had the alarming headline: “Tariffs Send Dow to 1600-Point Decline, Dollar Slumps” This gloomily declared: “U.S. markets suffered their steepest declines since 2020 on fears President Trump’s new tariff plans will trigger a global trade war and drag the U.S. economy into recession… the decline sets up financial markets for one of their most precarious periods in recent years ”
Almost simultaneously, the U.S. investment bank JP Morgan analysts raised their “forecast of the likelihood of a recession to 60%”, Vanguard, one of the U.S.’s largest funds, with $10.4 trillion in assets under management: “slashed its full-year U.S. economic growth forecast to less than 1%, blaming tariffs, and related policy uncertainty. It expects 4% inflation by the end of the year, up from a 2.7% forecast previously.”
However, by less than a month later, on May 3, the Wall Street Journal was carrying an article with the exact opposite type of headline: “What Recession? Stock Investors Expect the Good Times to Continue” This declared: “Wall Street’s best forecasters have been warning that tariffs could spark a recession. Goldman Sachs puts the chance at 45% over the next 12 months. Apollo Global Management’s top economist recently pegged it to 90%. Someone forgot to tell the stock traders. The market is roaring ahead.” However, on May 7, the Wall Street Journal was claiming an article. “it seems likely that if the tariffs proceed, the U.S. and most of the world will fall into recession in 2025.”
In reality neither the “depressive” nor the “manic” analyses of the U.S. economy was justified – as an analysis of both medium and long-term U.S. trends, as opposed to purely short term shifts, clearly shows.
In fact as, the present author wrote in an article in Guancha.cn, 拜特朗普关税战所赐,中国对美经济增速优势扩大: “It is important to understand that the U.S. economy was going to slow down in 2025 even before Trump launched his ill-judged tariff announcements. The reason for this is that in the recent period, as the U.S. recovered after Covid in an economic upswing of the business cycle, the United States grew well above its medium/long-term growth rate. “
Part 2 of this article examines the determinants of the “prolonged” struggle with the U.S.. However, evidently by definition, it takes some time for these long-term processes to manifest themselves. But any short-term deep disturbances would appear in U.S. financial markets. Therefore, we start with an analysis of whether any changes in U.S. financial markets are taking place that are greater than would be expected from normal business cycle fluctuations.
The U.S. Treasury bond market
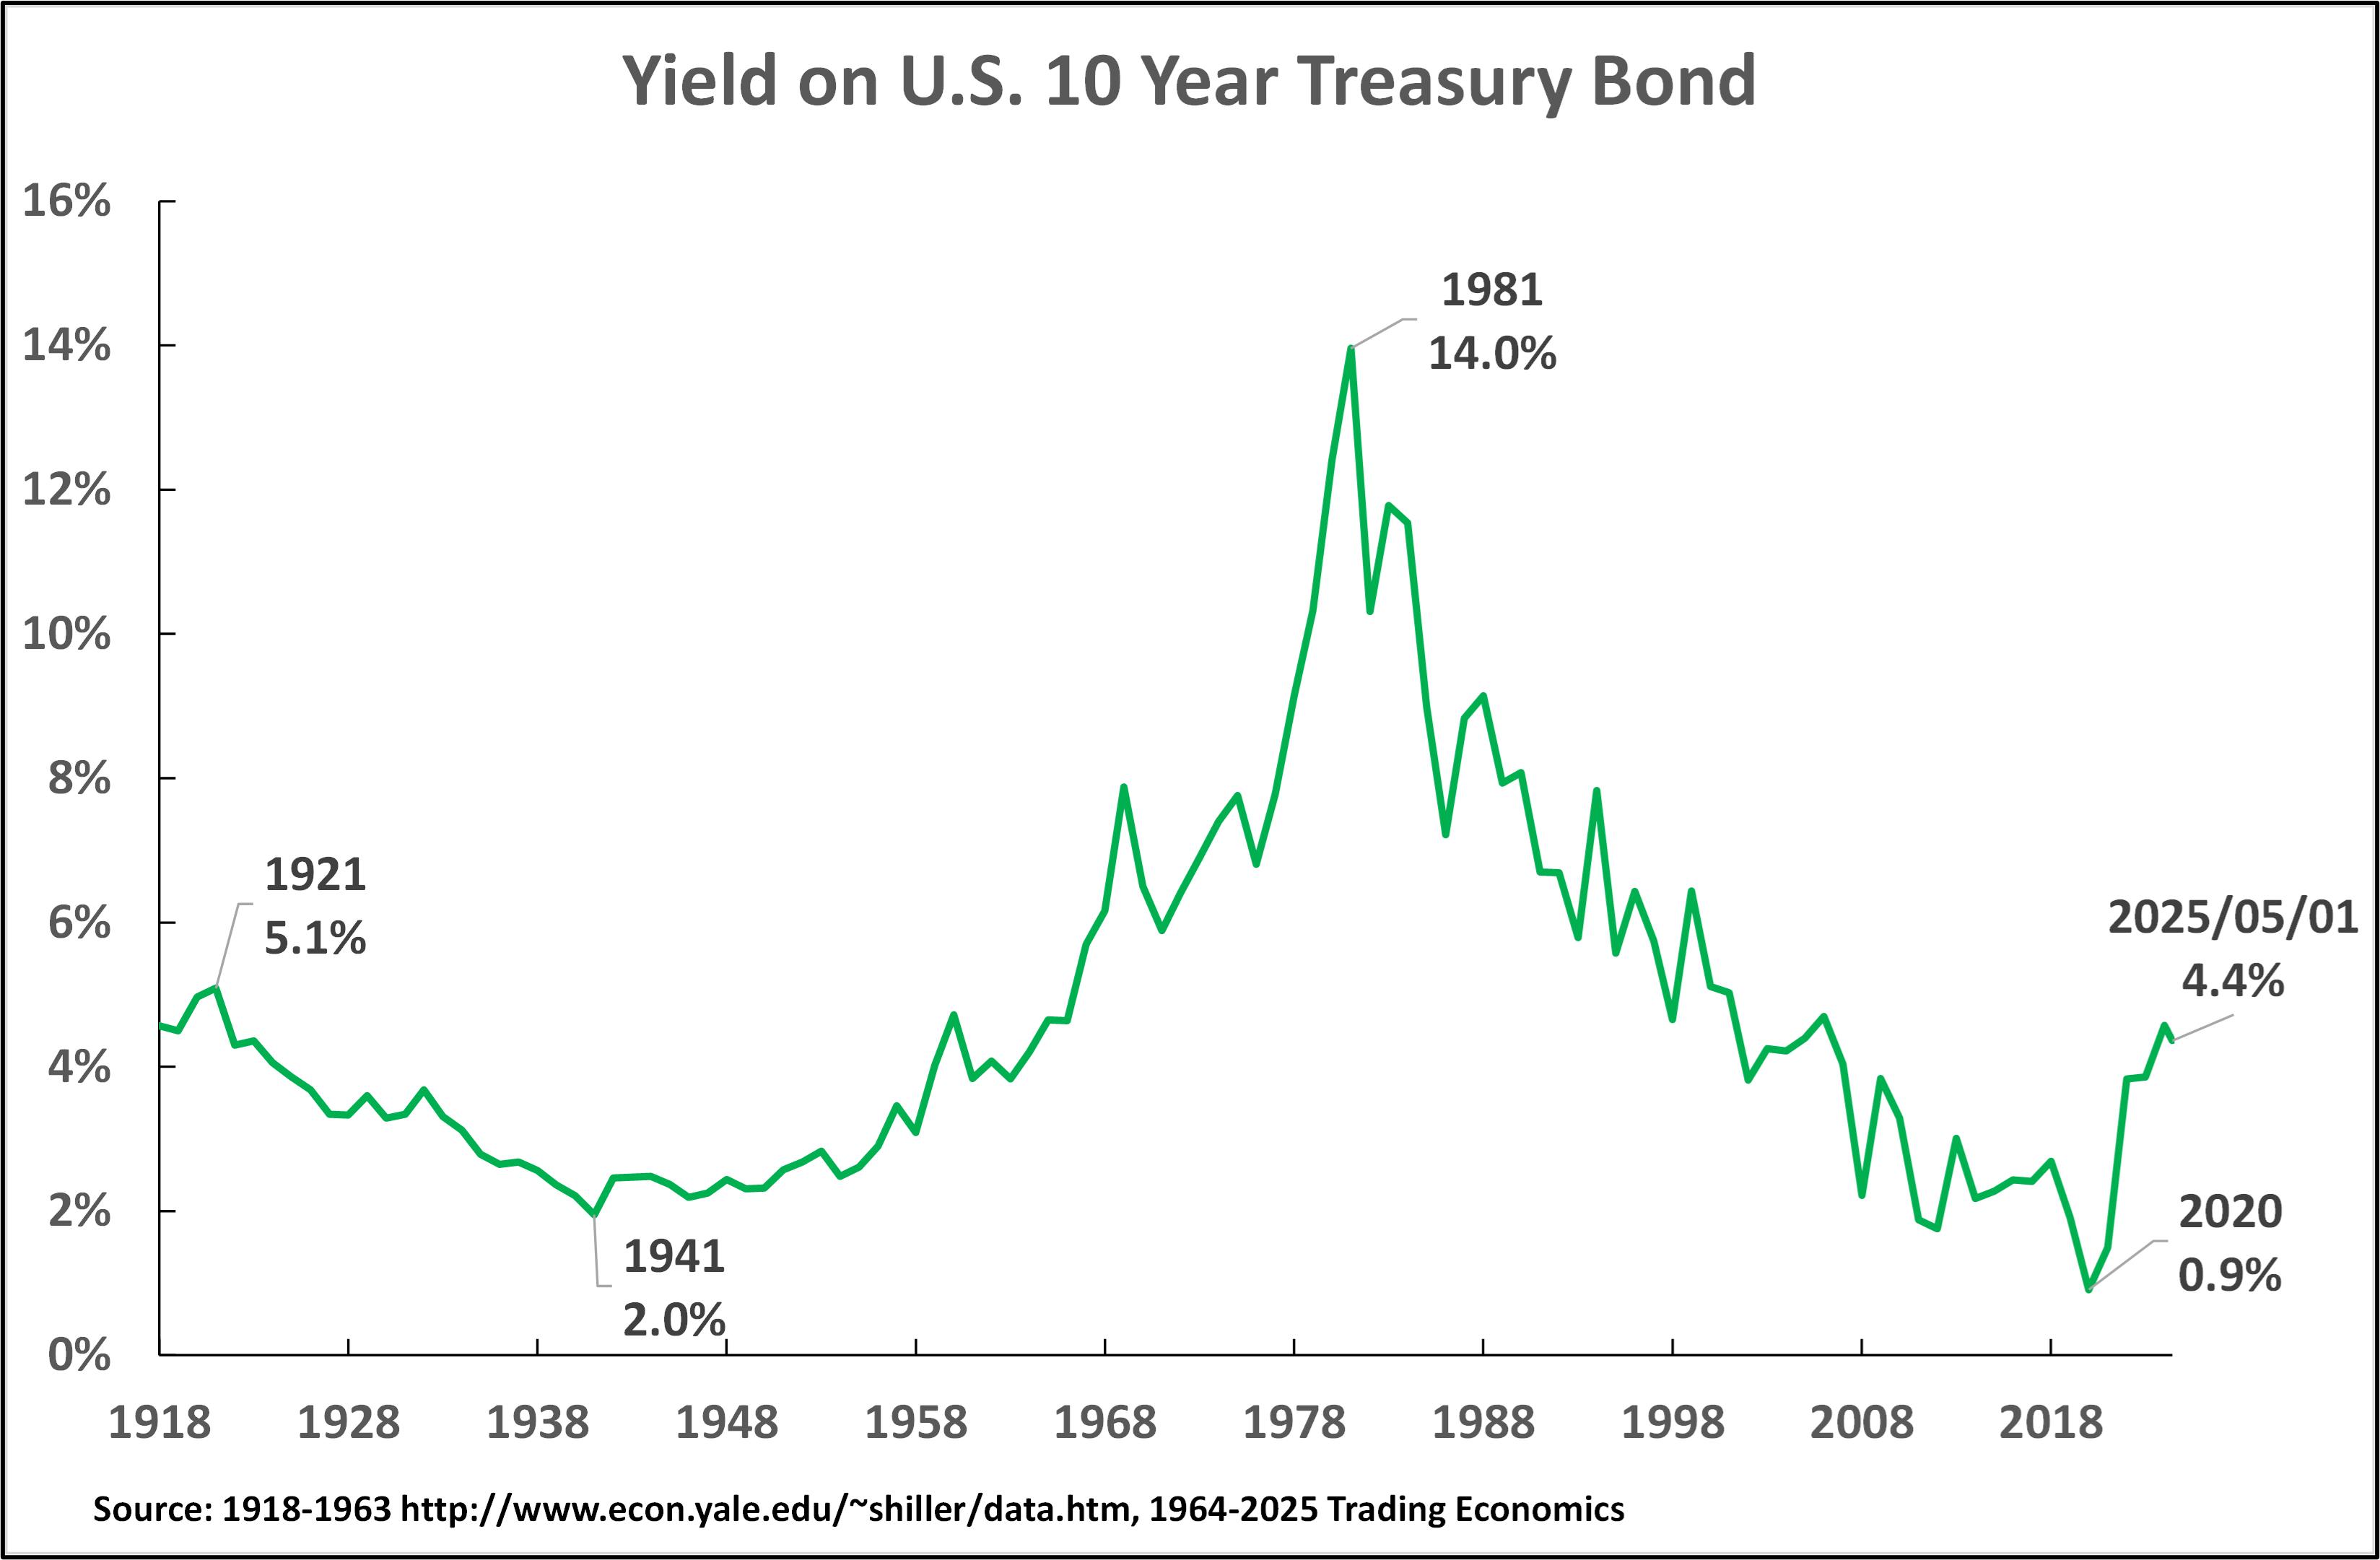
Starting with the U.S. 10-year Treasury Bond market, this is the most important long-term interest rate in the world, affecting not only the U.S. domestic, but all global financial markets.
Figure 1 shows clearly that during the last century the yield on U.S. Treasury bonds follows clear long-term trends - this chart should be compulsory reading for all those who concentrate only on what are, in comparative terms, short term smaller fluctuations and fail to understand that through these the long term much more powerful and larger economic processes show themselves. Operating through innumerable short-term fluctuations, the trends on U.S. Treasury bonds are clearly determined by the following four long-term large-scale trends.
1921-1941, a 20-year trend of falling Treasury bond yields - with a drop from 5.1% in 1921 to 2.0% in 1941.
1941-1981, a 40-year period of rising yields - increasing from 2.0% in 1941 to 14.0% in 1981.
1981-2020, a 39 year period of falling yields - with a drop from 14.0% in 1981 to 0.9% in 2020.
2020 to the present, a 5-year period of rising yields - starting from 0.9% and so far reaching a peak of 4.99% in October 2023.
Looking at the last of these trends, it is highly probable that another long wave of rising U.S. Treasuring bond yields is beginning, although, of course, further observation of the data is necessary to confirm this.
Figure 1
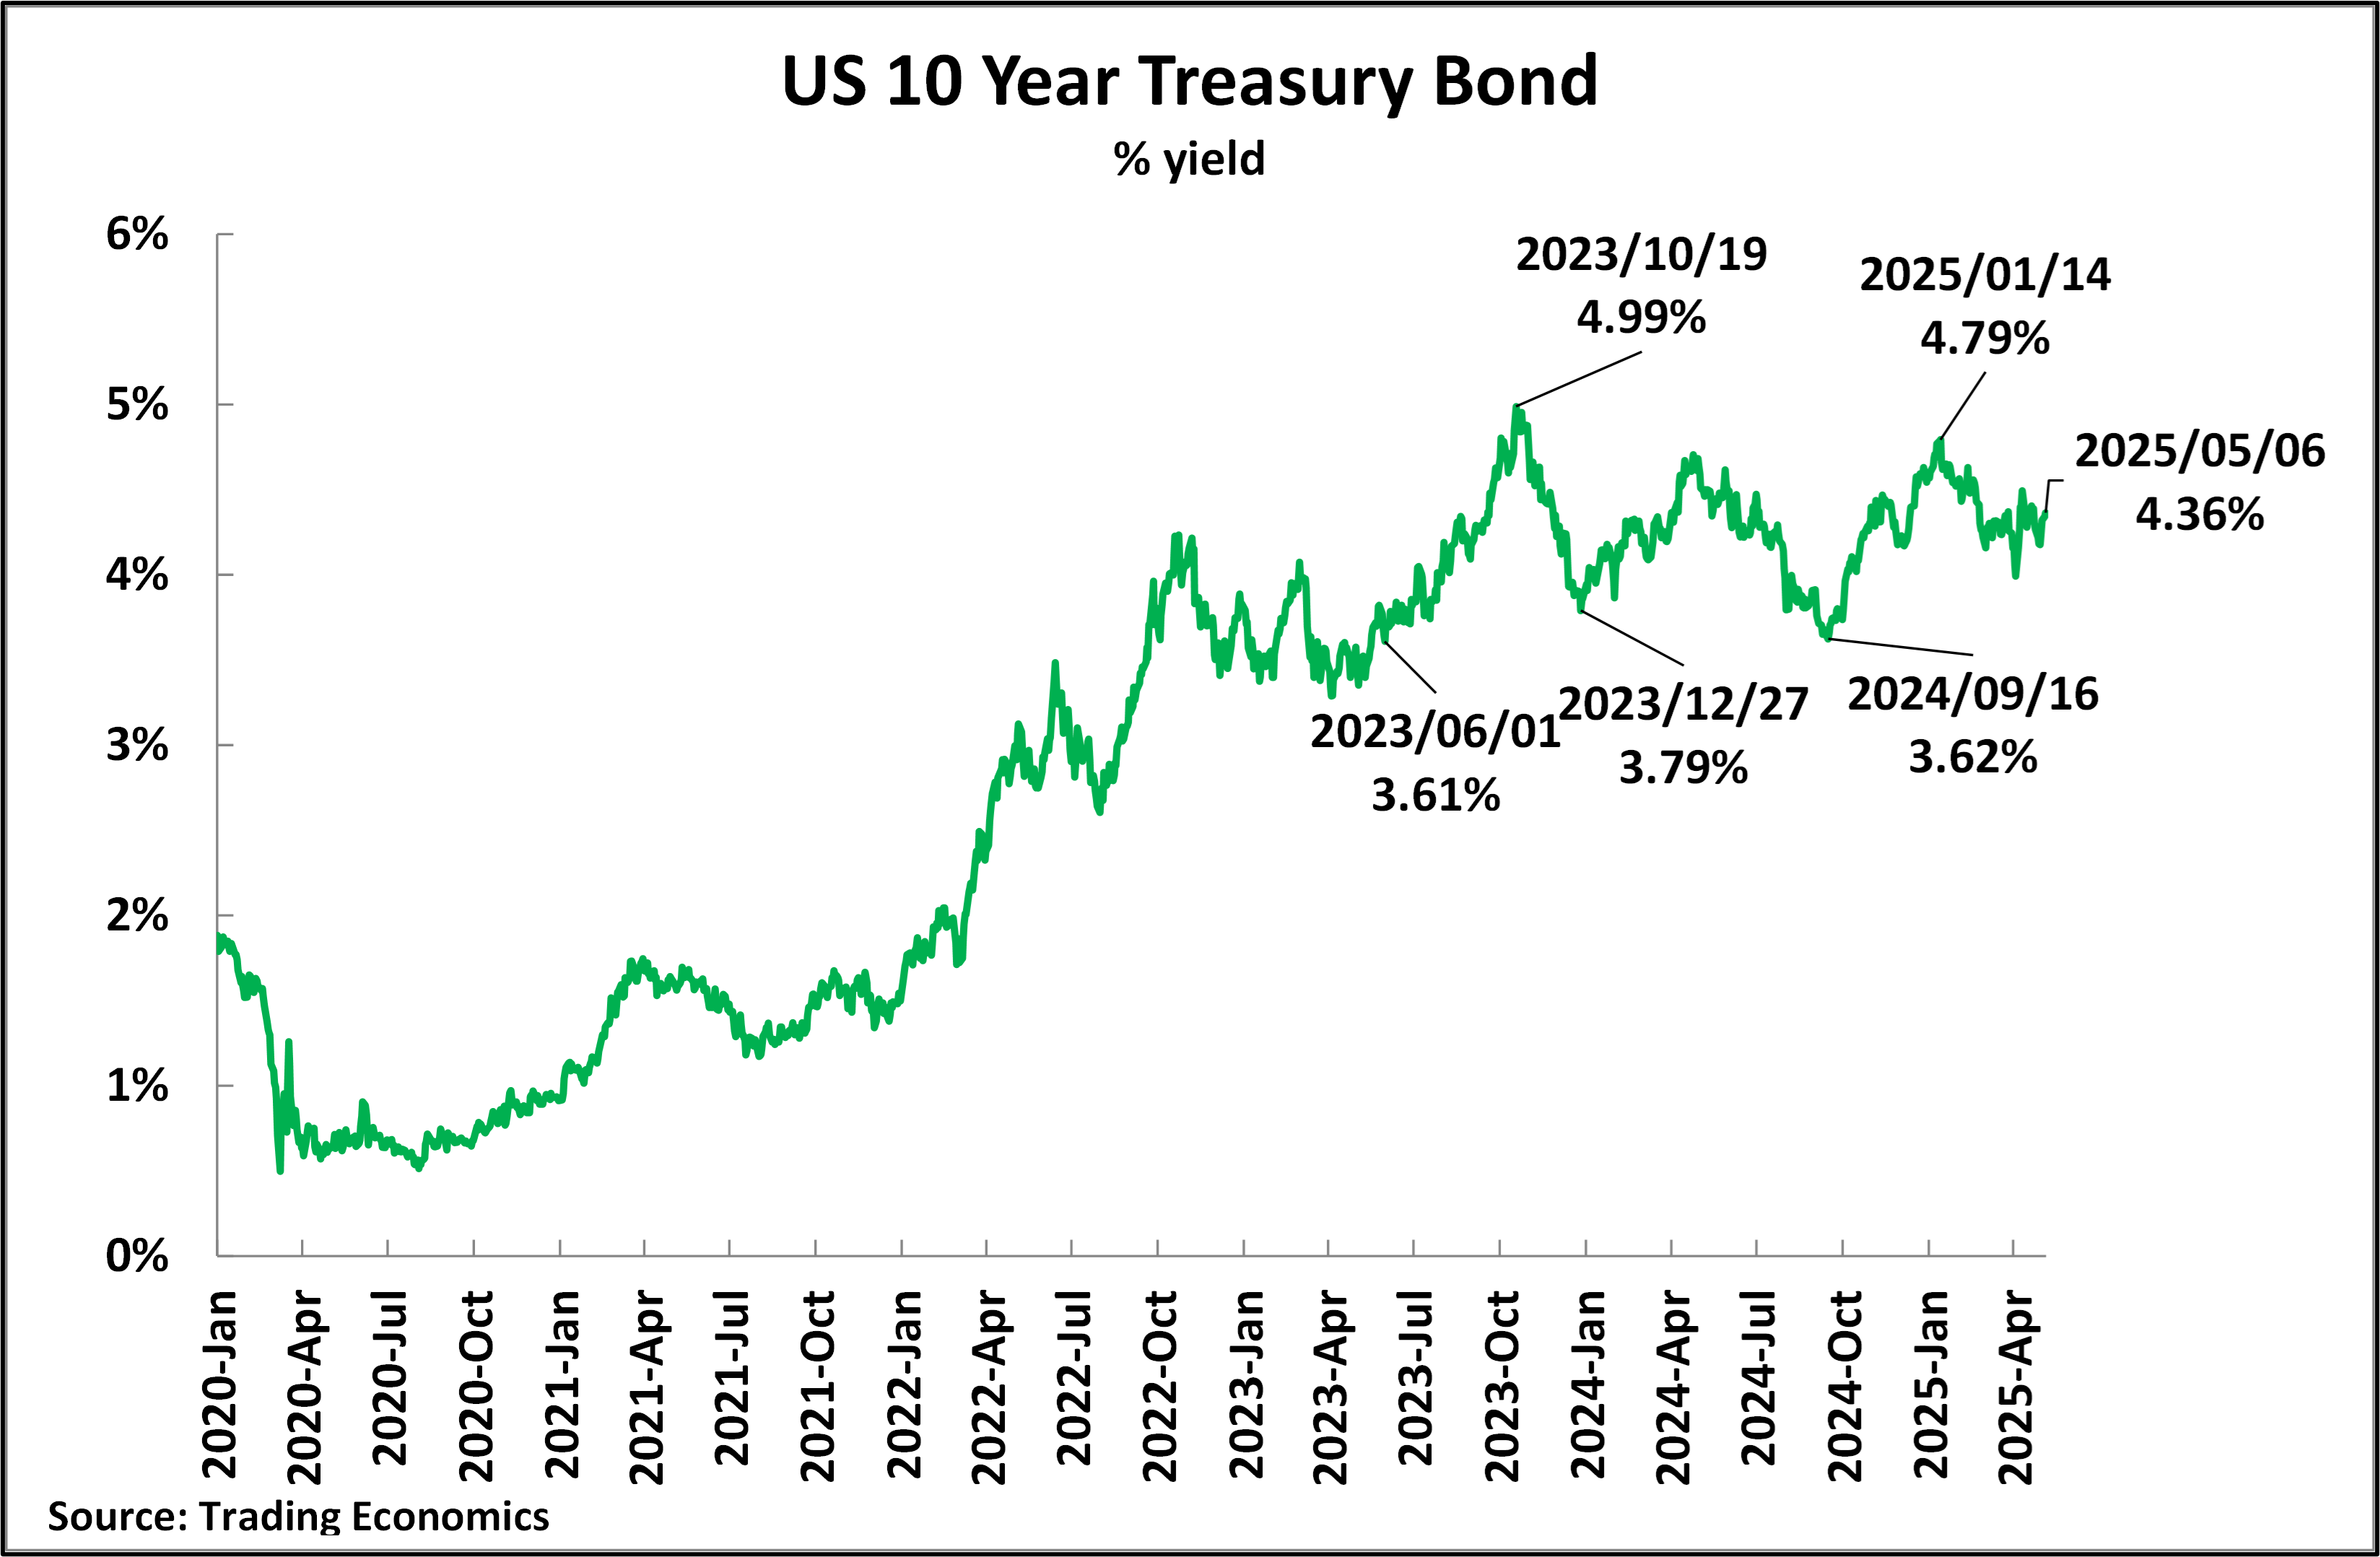
Within this framework, turning to a more detailed examination of the response to Trump’s tariffs, Figure 2 illustrates the last of the four periods that were shown to exist above - the rising period of yields during the last five years. Within this overall rising trend, during the last two years from June 2023 to May 2025, the 10-year Treasury bond yield fluctuated in a trading band between 3.6% and 5.0%.
Figure 2
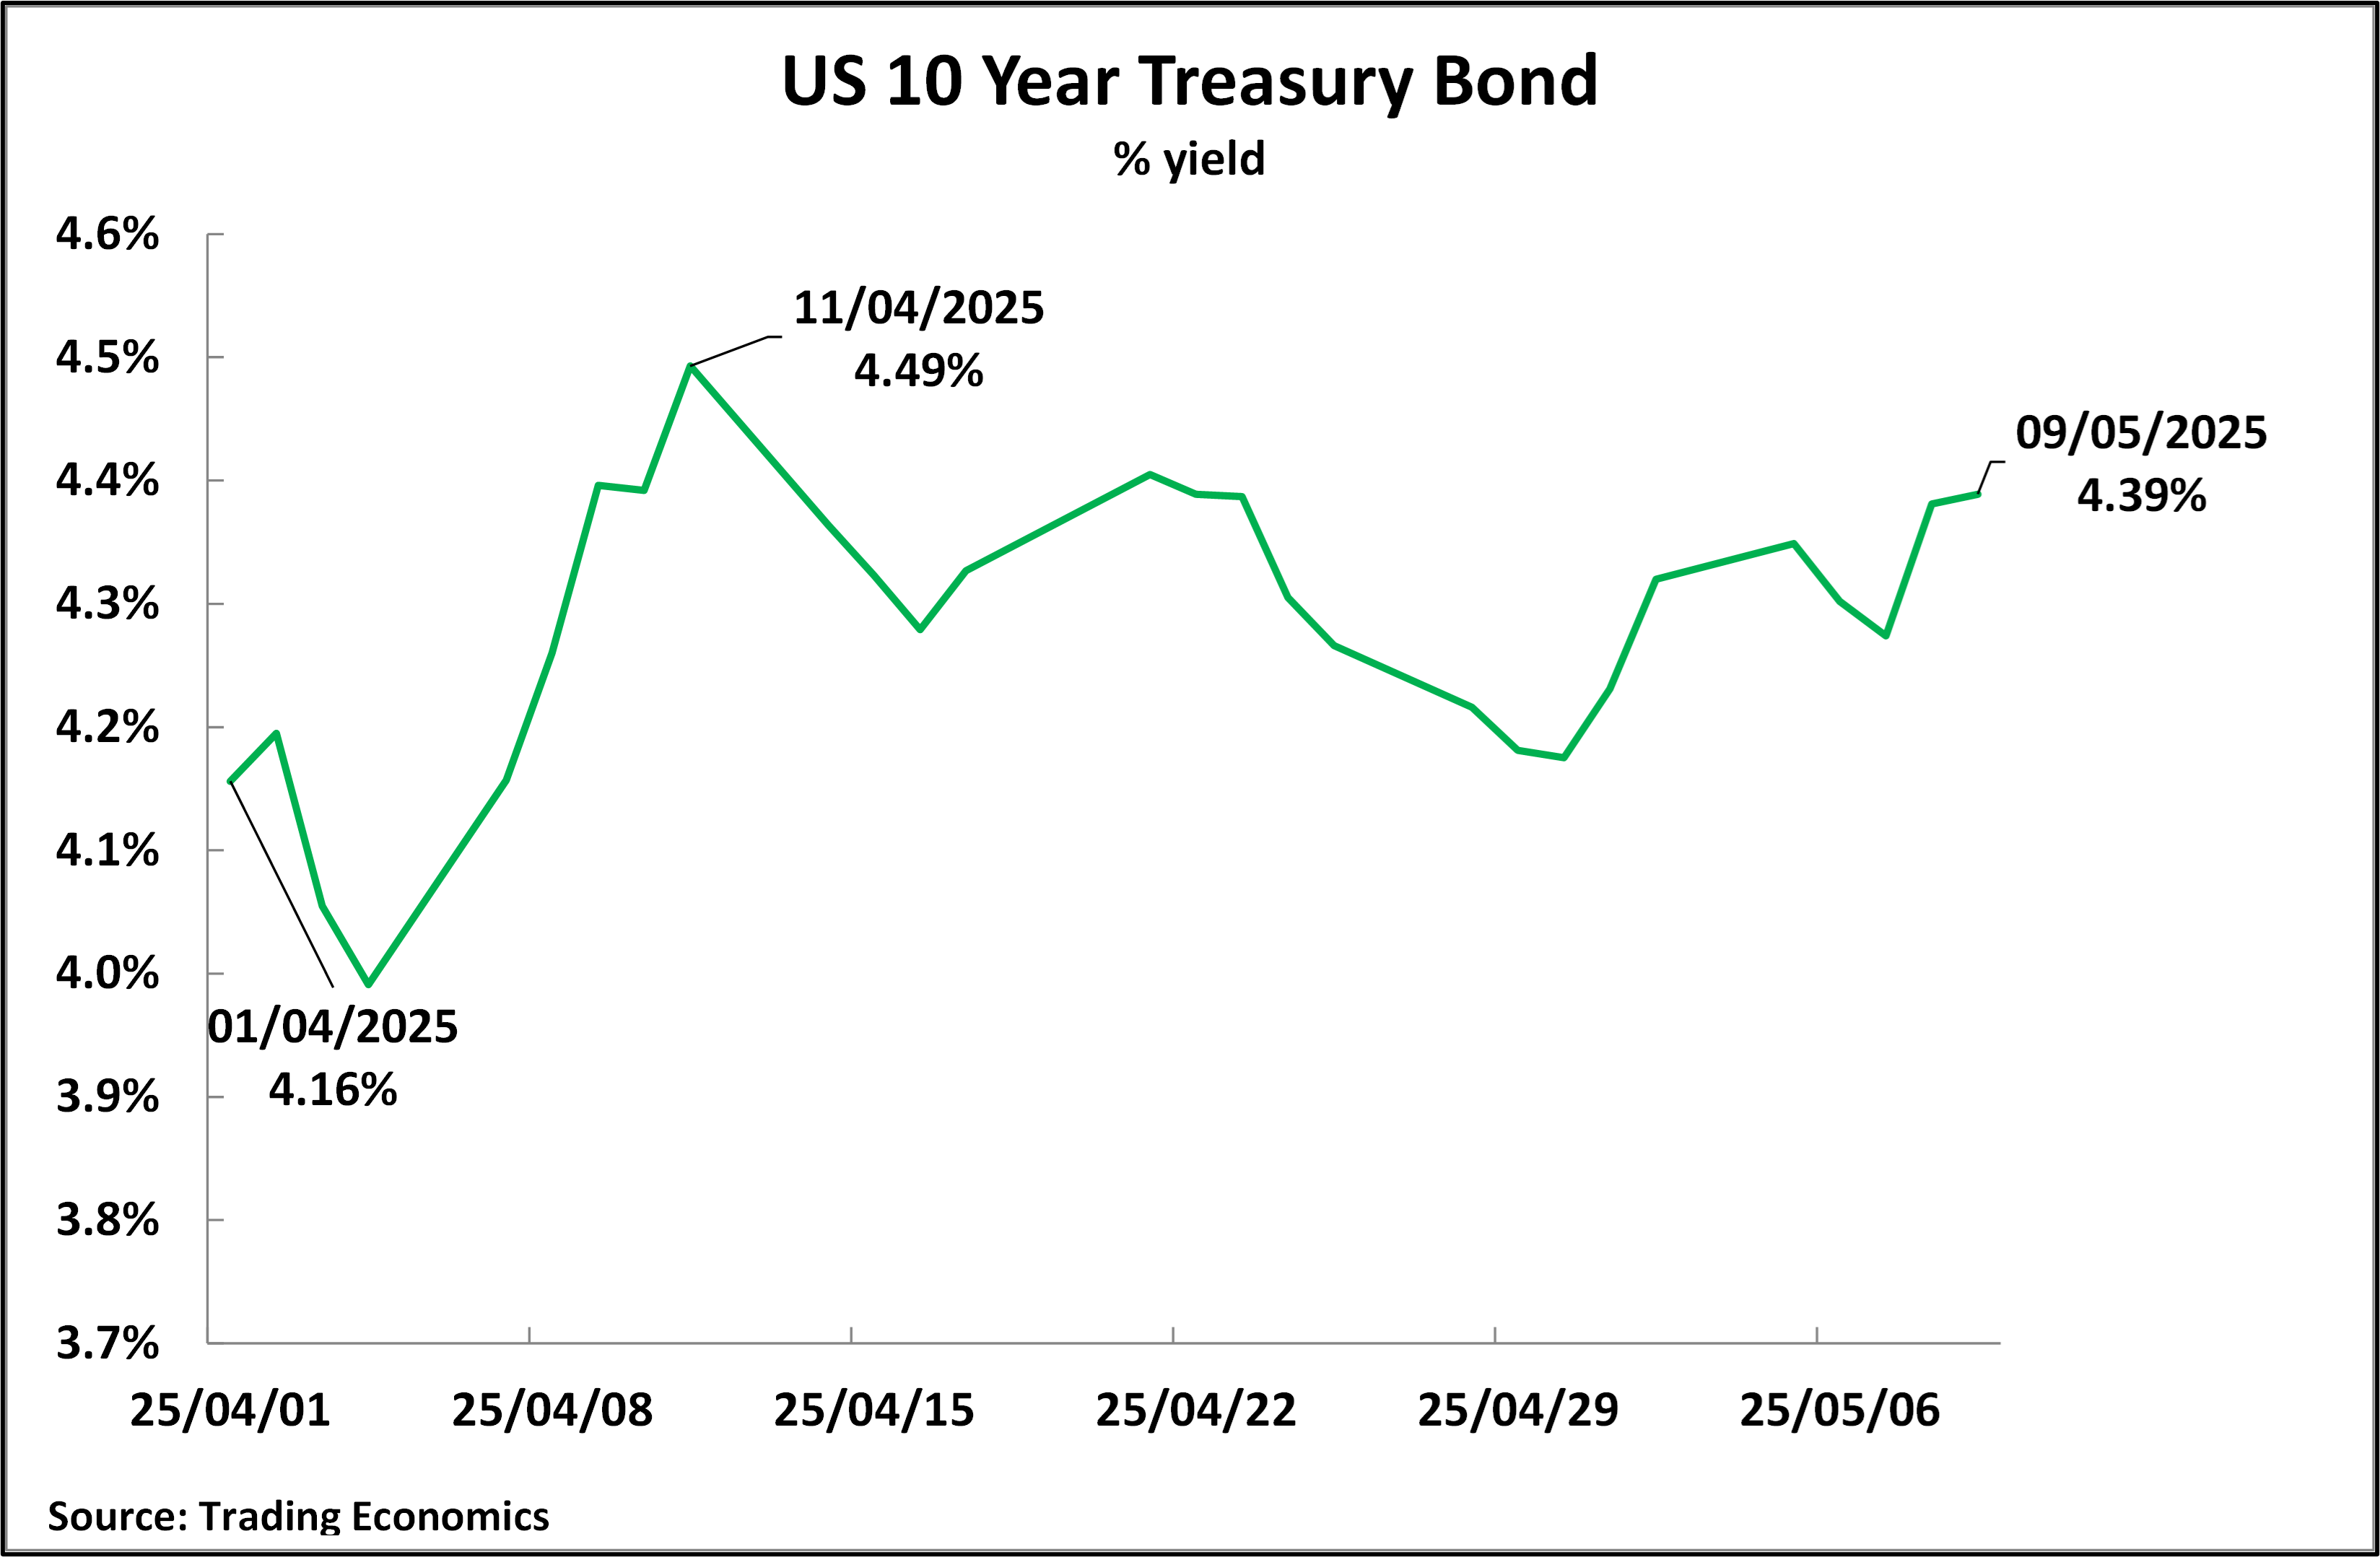
Turning in more detail to the period from April 1, that is, the day before Trump’s “reciprocal tariff” announcements on April 2, Figure 3 shows that nothing has occurred, which takes Treasury bond prices outside the previous trading range. On April 1, the yield was 4.16%, which rose sharply to 4.49% by April 11, but then fell; by May 6, it was only 4.36%, comfortably within the last two years, with a trading range of 3.6%-5.0%. On May 9, the last trading day before the announcement of the 90-day–US China trade agreement, the yield was 4.39%. On the last trading day at the time of writing, 23 May, the yield was 4.50% - entirely within the range in which the 10-year Treasury has been trading for the last two years.
Some media attention has recently been given to fluctuations in the very long-term U.S. 30 year Treasury Bond, which is much less important in setting market interest rates than the 10 year bond, but on the last trading day at the time of writing, 23 May, its yield at 5.00% was still lower than its level of 5.10 in October 2023 – i.e. even the 30 year bond had not broken out of its trading range of the last two years.
Figure 3
U.S. share markets
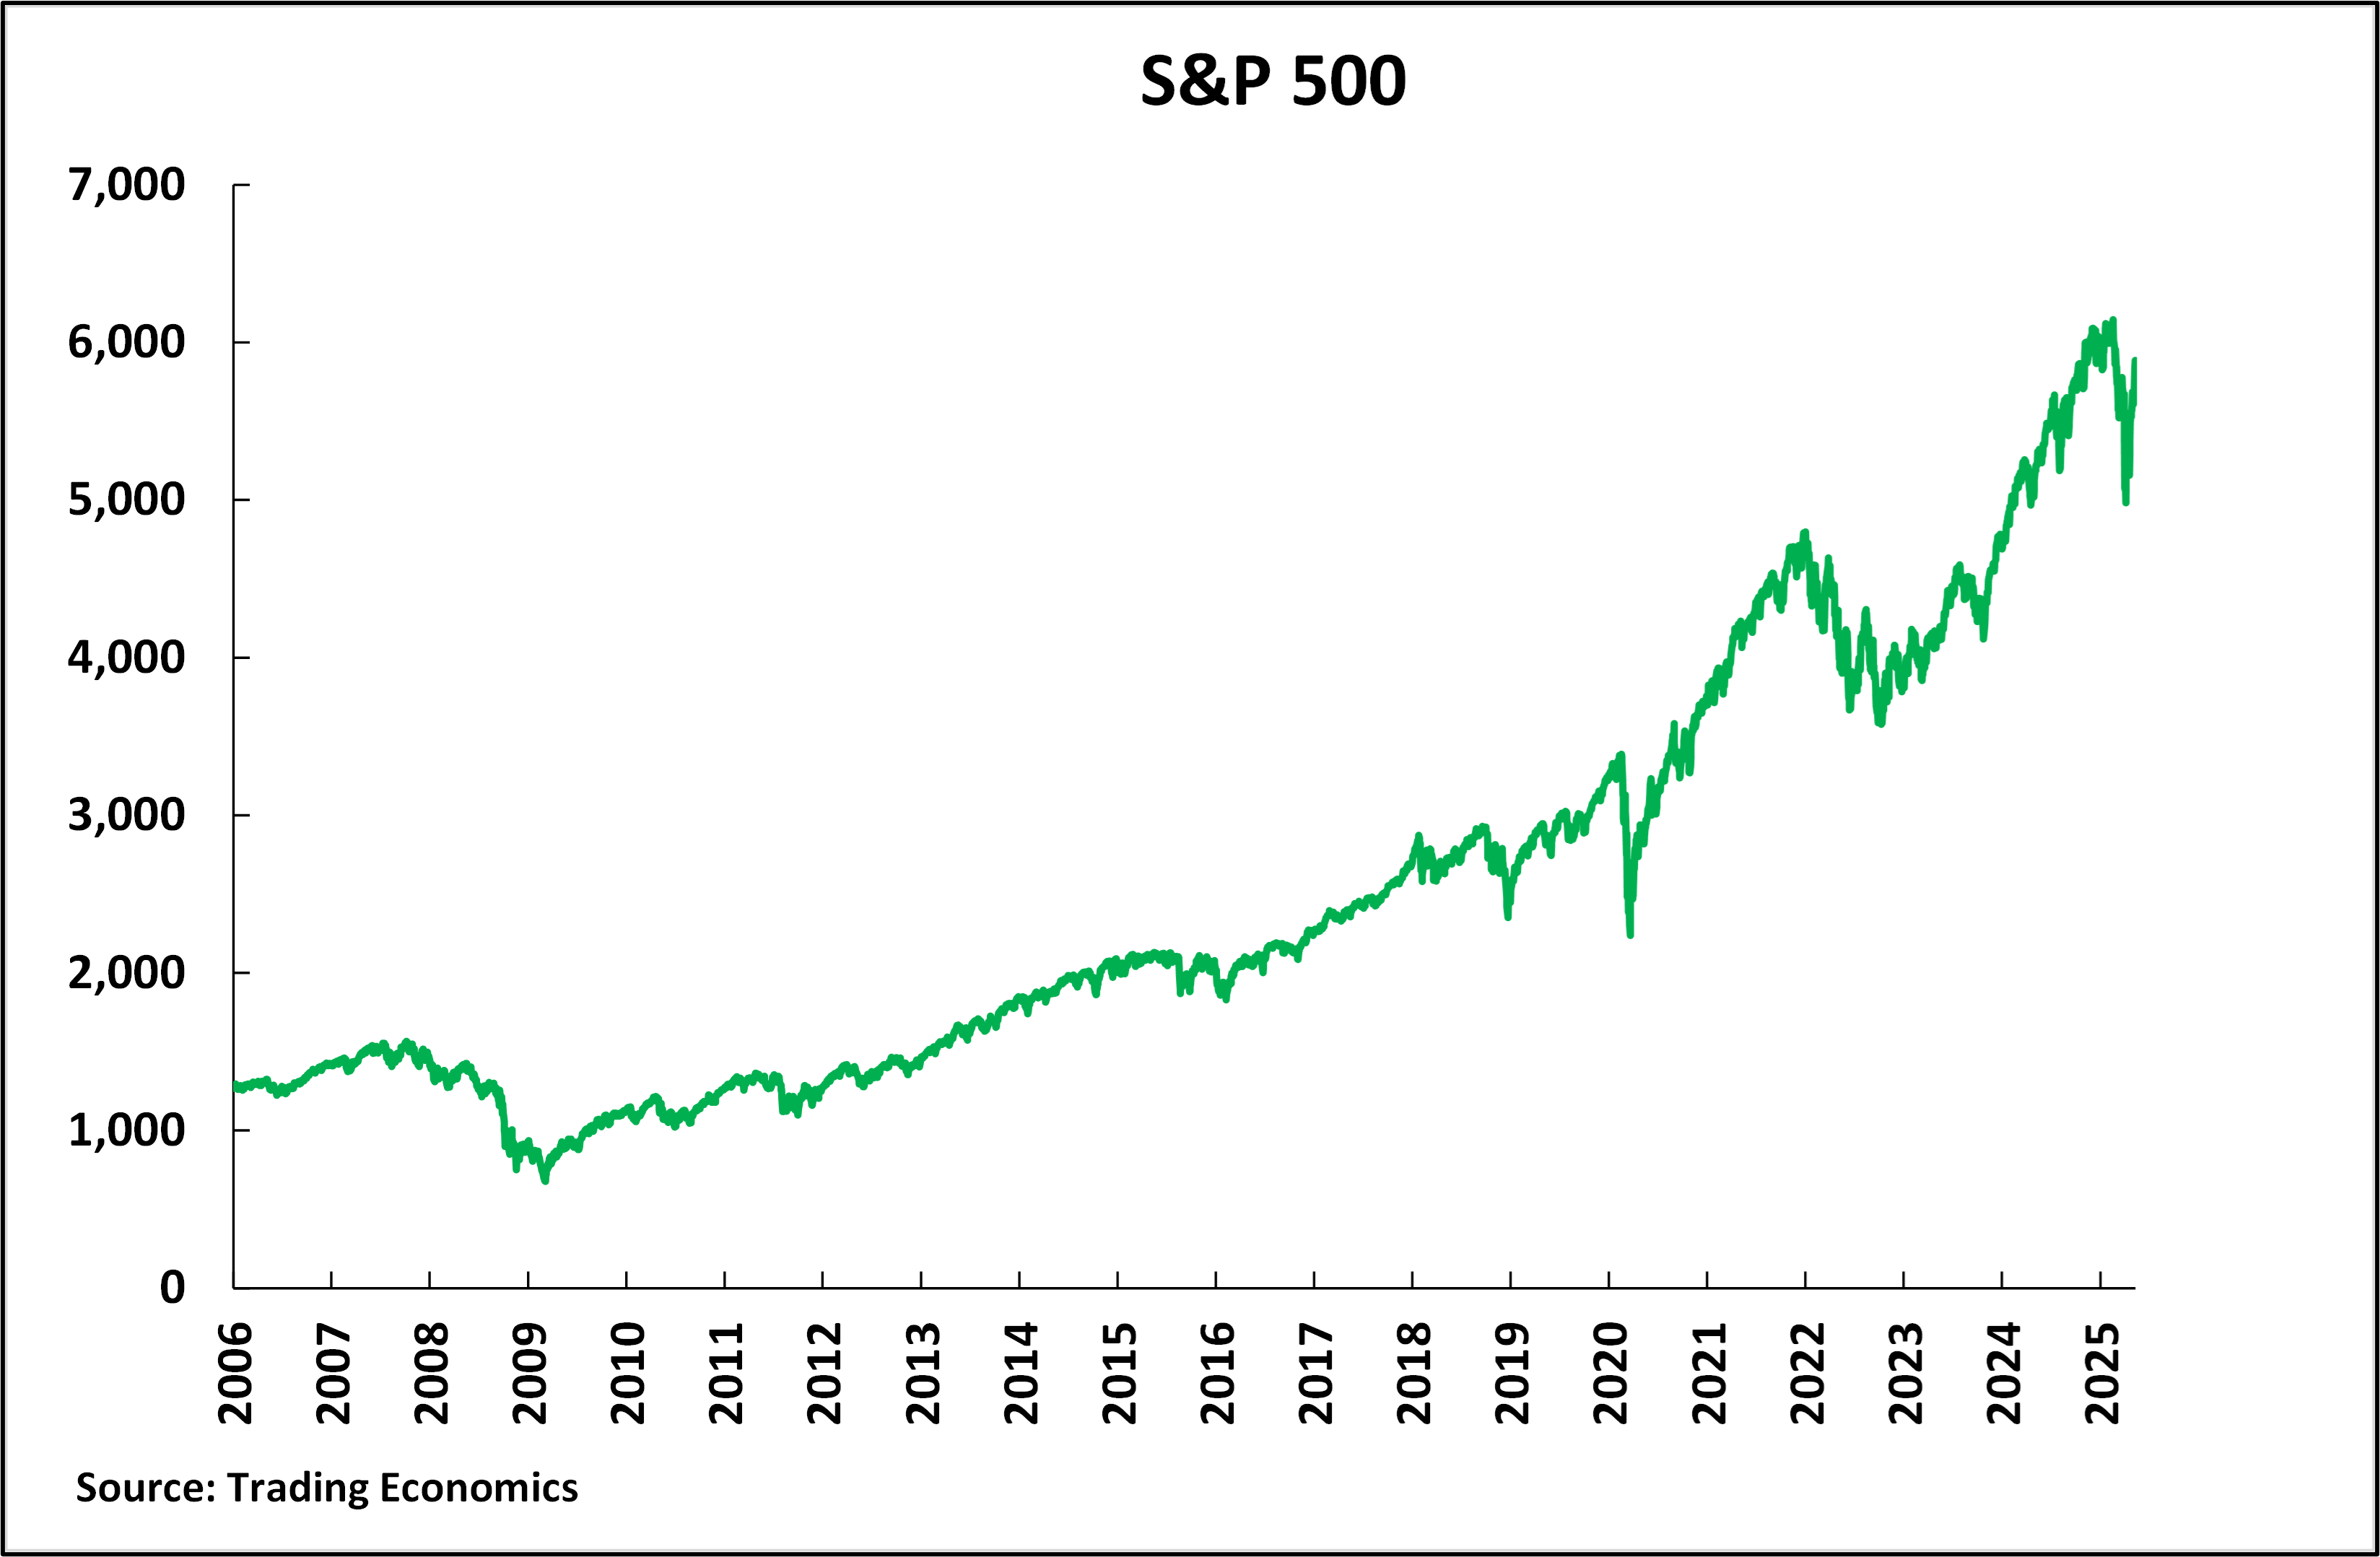
Turning to U.S. share prices, Figure 4 shows the data for the S&P 500 from prior to the international financial crisis to the latest data, that is, from 2006 to May 2025. It may be seen that in this almost 20-year period there were four major episodes of falling prices. Prior to the fall, which has been taking place in 2025, these three were the following:
Between 9 October 2007 and 9 March 2009 the S&P 500 fell by 57% - from 1,565 to 677.
Between 19 February 2020 and 23 March 2020 the S&P 500 fell by 34% - from 3,386 to 2,237.
Between 3 January 2022 and 12 October 2022, the S&P 500 fell by 25% - from 4,797 to 3,577.
Figure 4
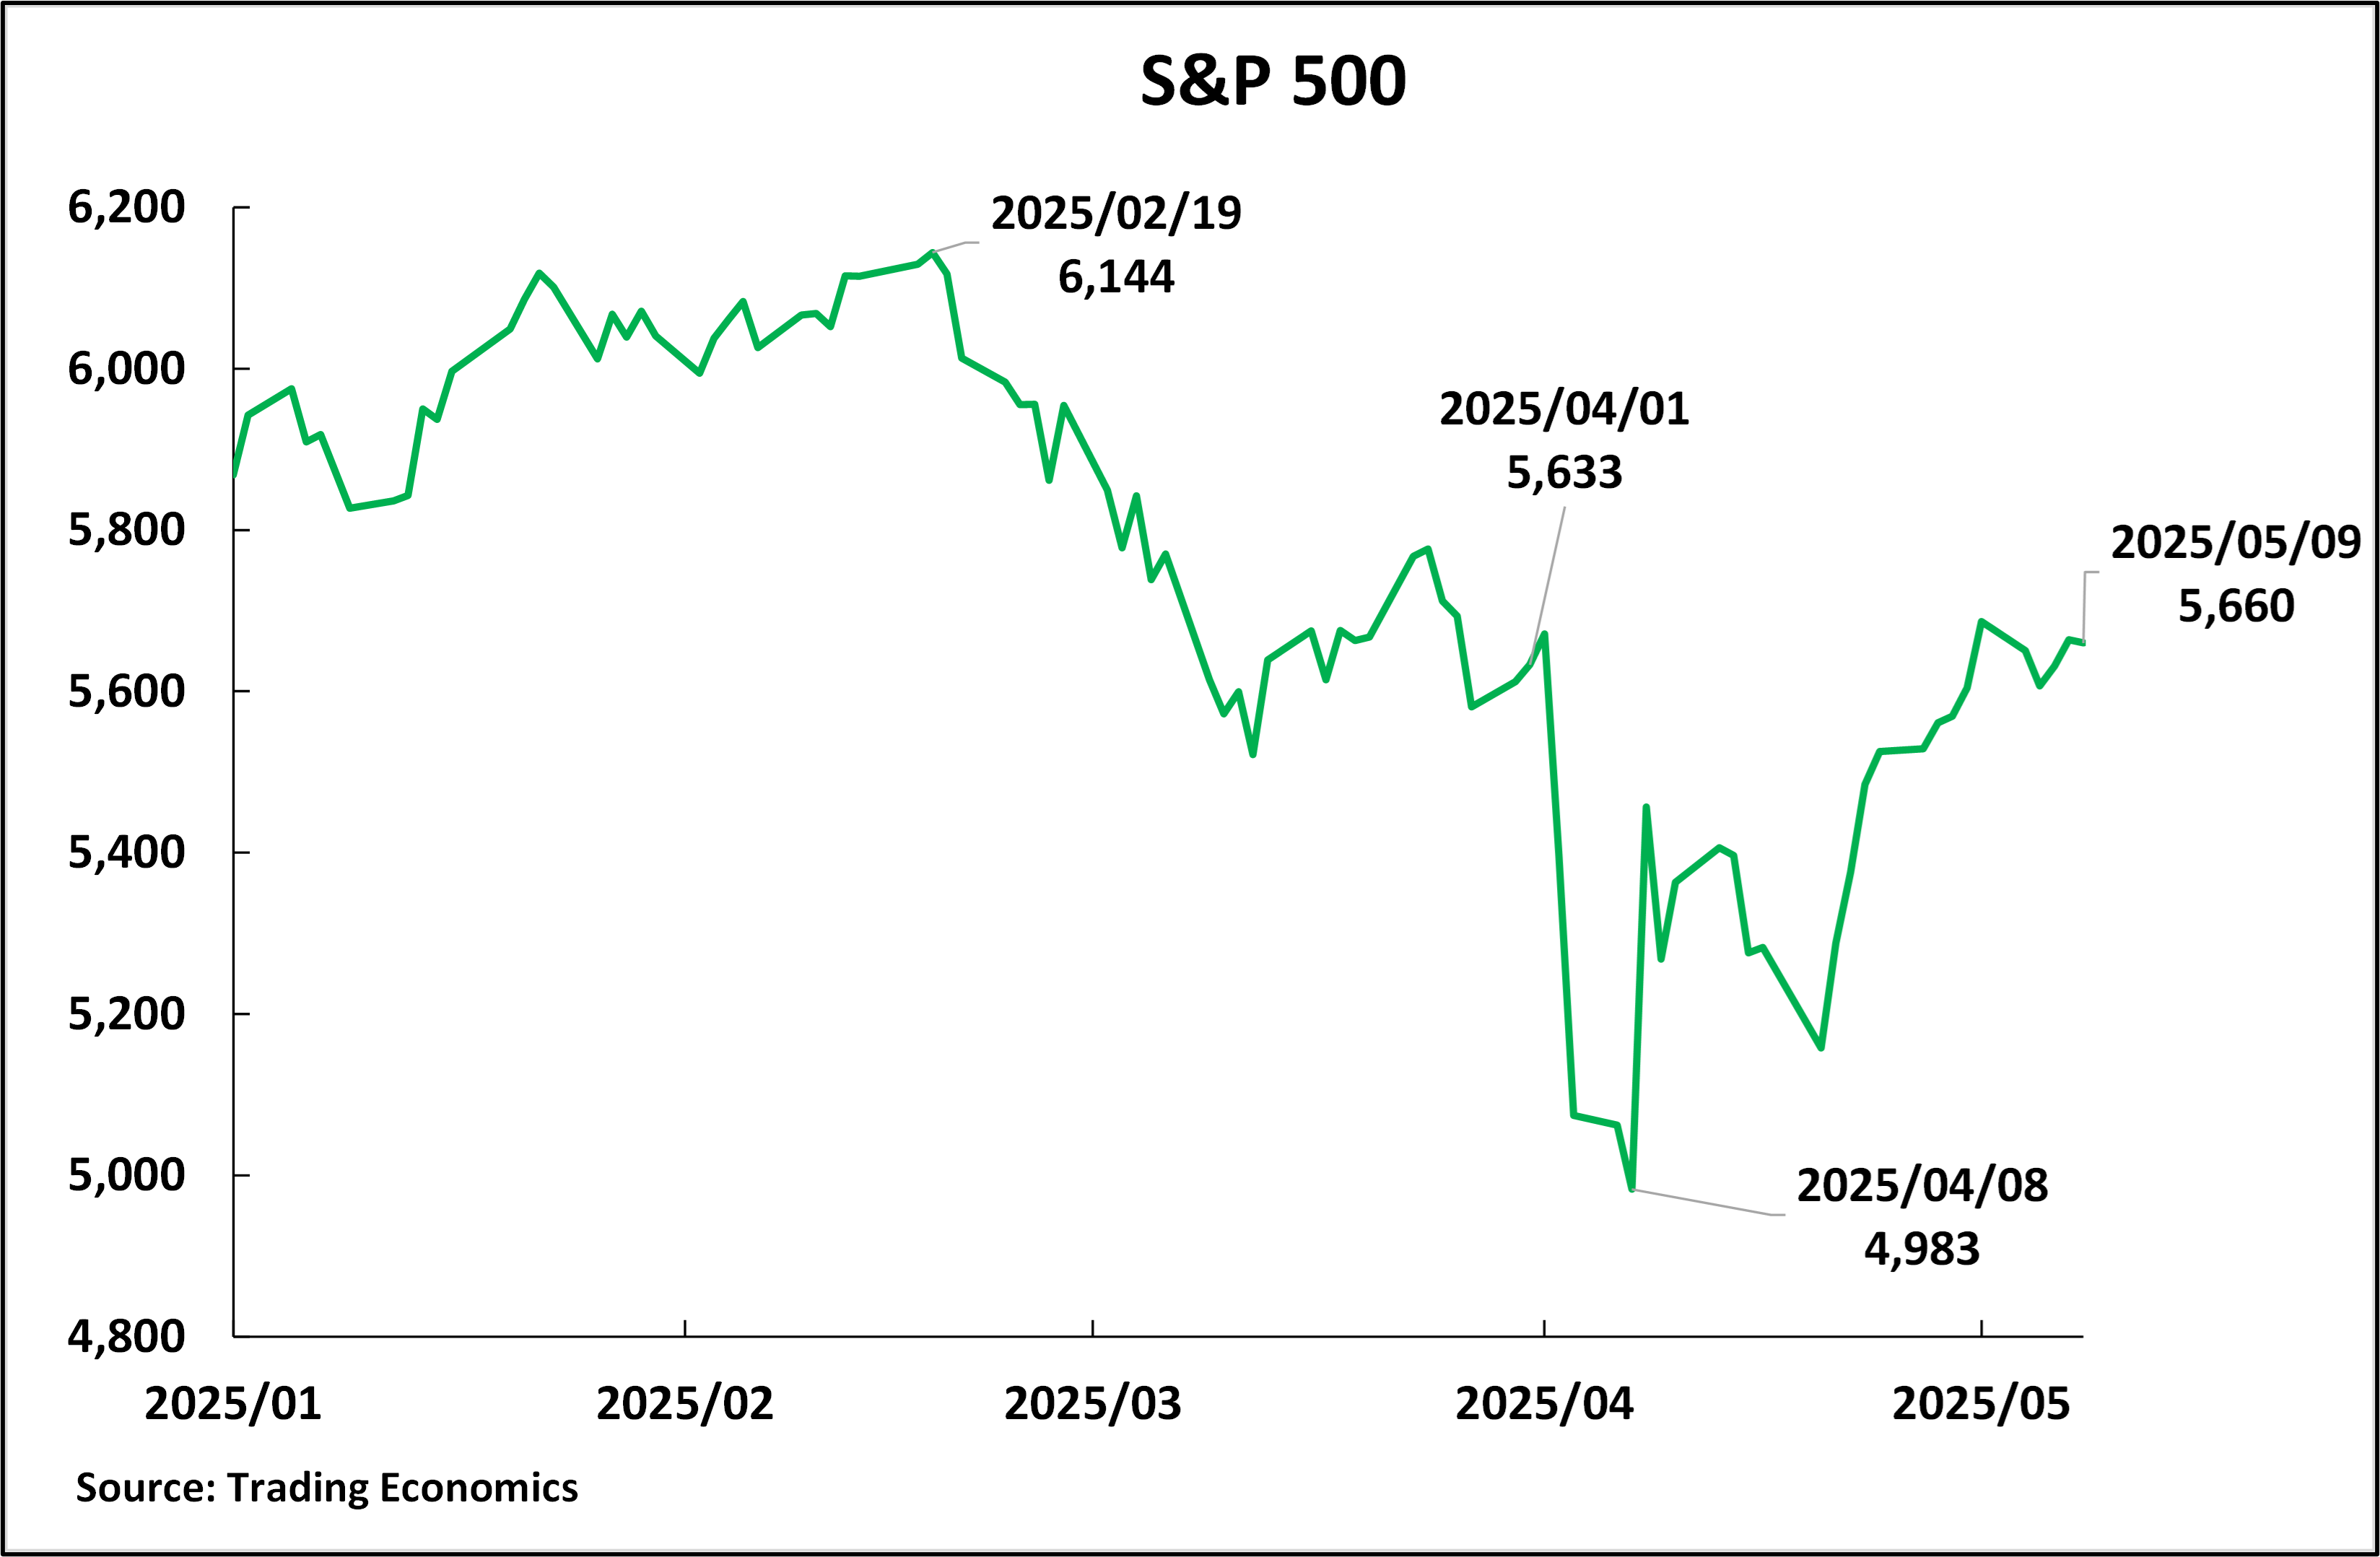
For comparison, Figure 5 shows the most recent period, 2025. The S&P 500 reached a peak of 6,144 on February 19, 2025, and it was already falling before Trump’s tariff announcement on April 2. Looking at the details, between April 1, 2025, and April 8, the S&P 500 decrease was 11.5%, from 5.633 and 4,983. Therefore:
Between the January peak and the bottom of this drop, following the imposition of tariffs, the decline was 19%.
Between 1 April and the bottom, it was a fall of 11.5%.
These were significant decreases, but they were smaller than the declines in 2007-2009, 2020, and 2022. That is, there was no sign that U.S. share markets were out of control, and anything outside of a normal range of periodic fluctuations occurred. By May 9, the last trading day before the announcement of the U.S.–China 90-day trade agreement, the S&P 500 was 5,660, which is above the level on April 1, that is the day before Trump made his “reciprocal tariff” announcements. On the last trading day at the time of writing, 23 May, the S&P 500 was at 5,771 – above its level on 1 April, the day before Trump’s “reciprocal tariff” announcements.
Figure 5
The dollar exchange rate
Finally, considering the major financial markets, the dollar’s exchange rate is considered.
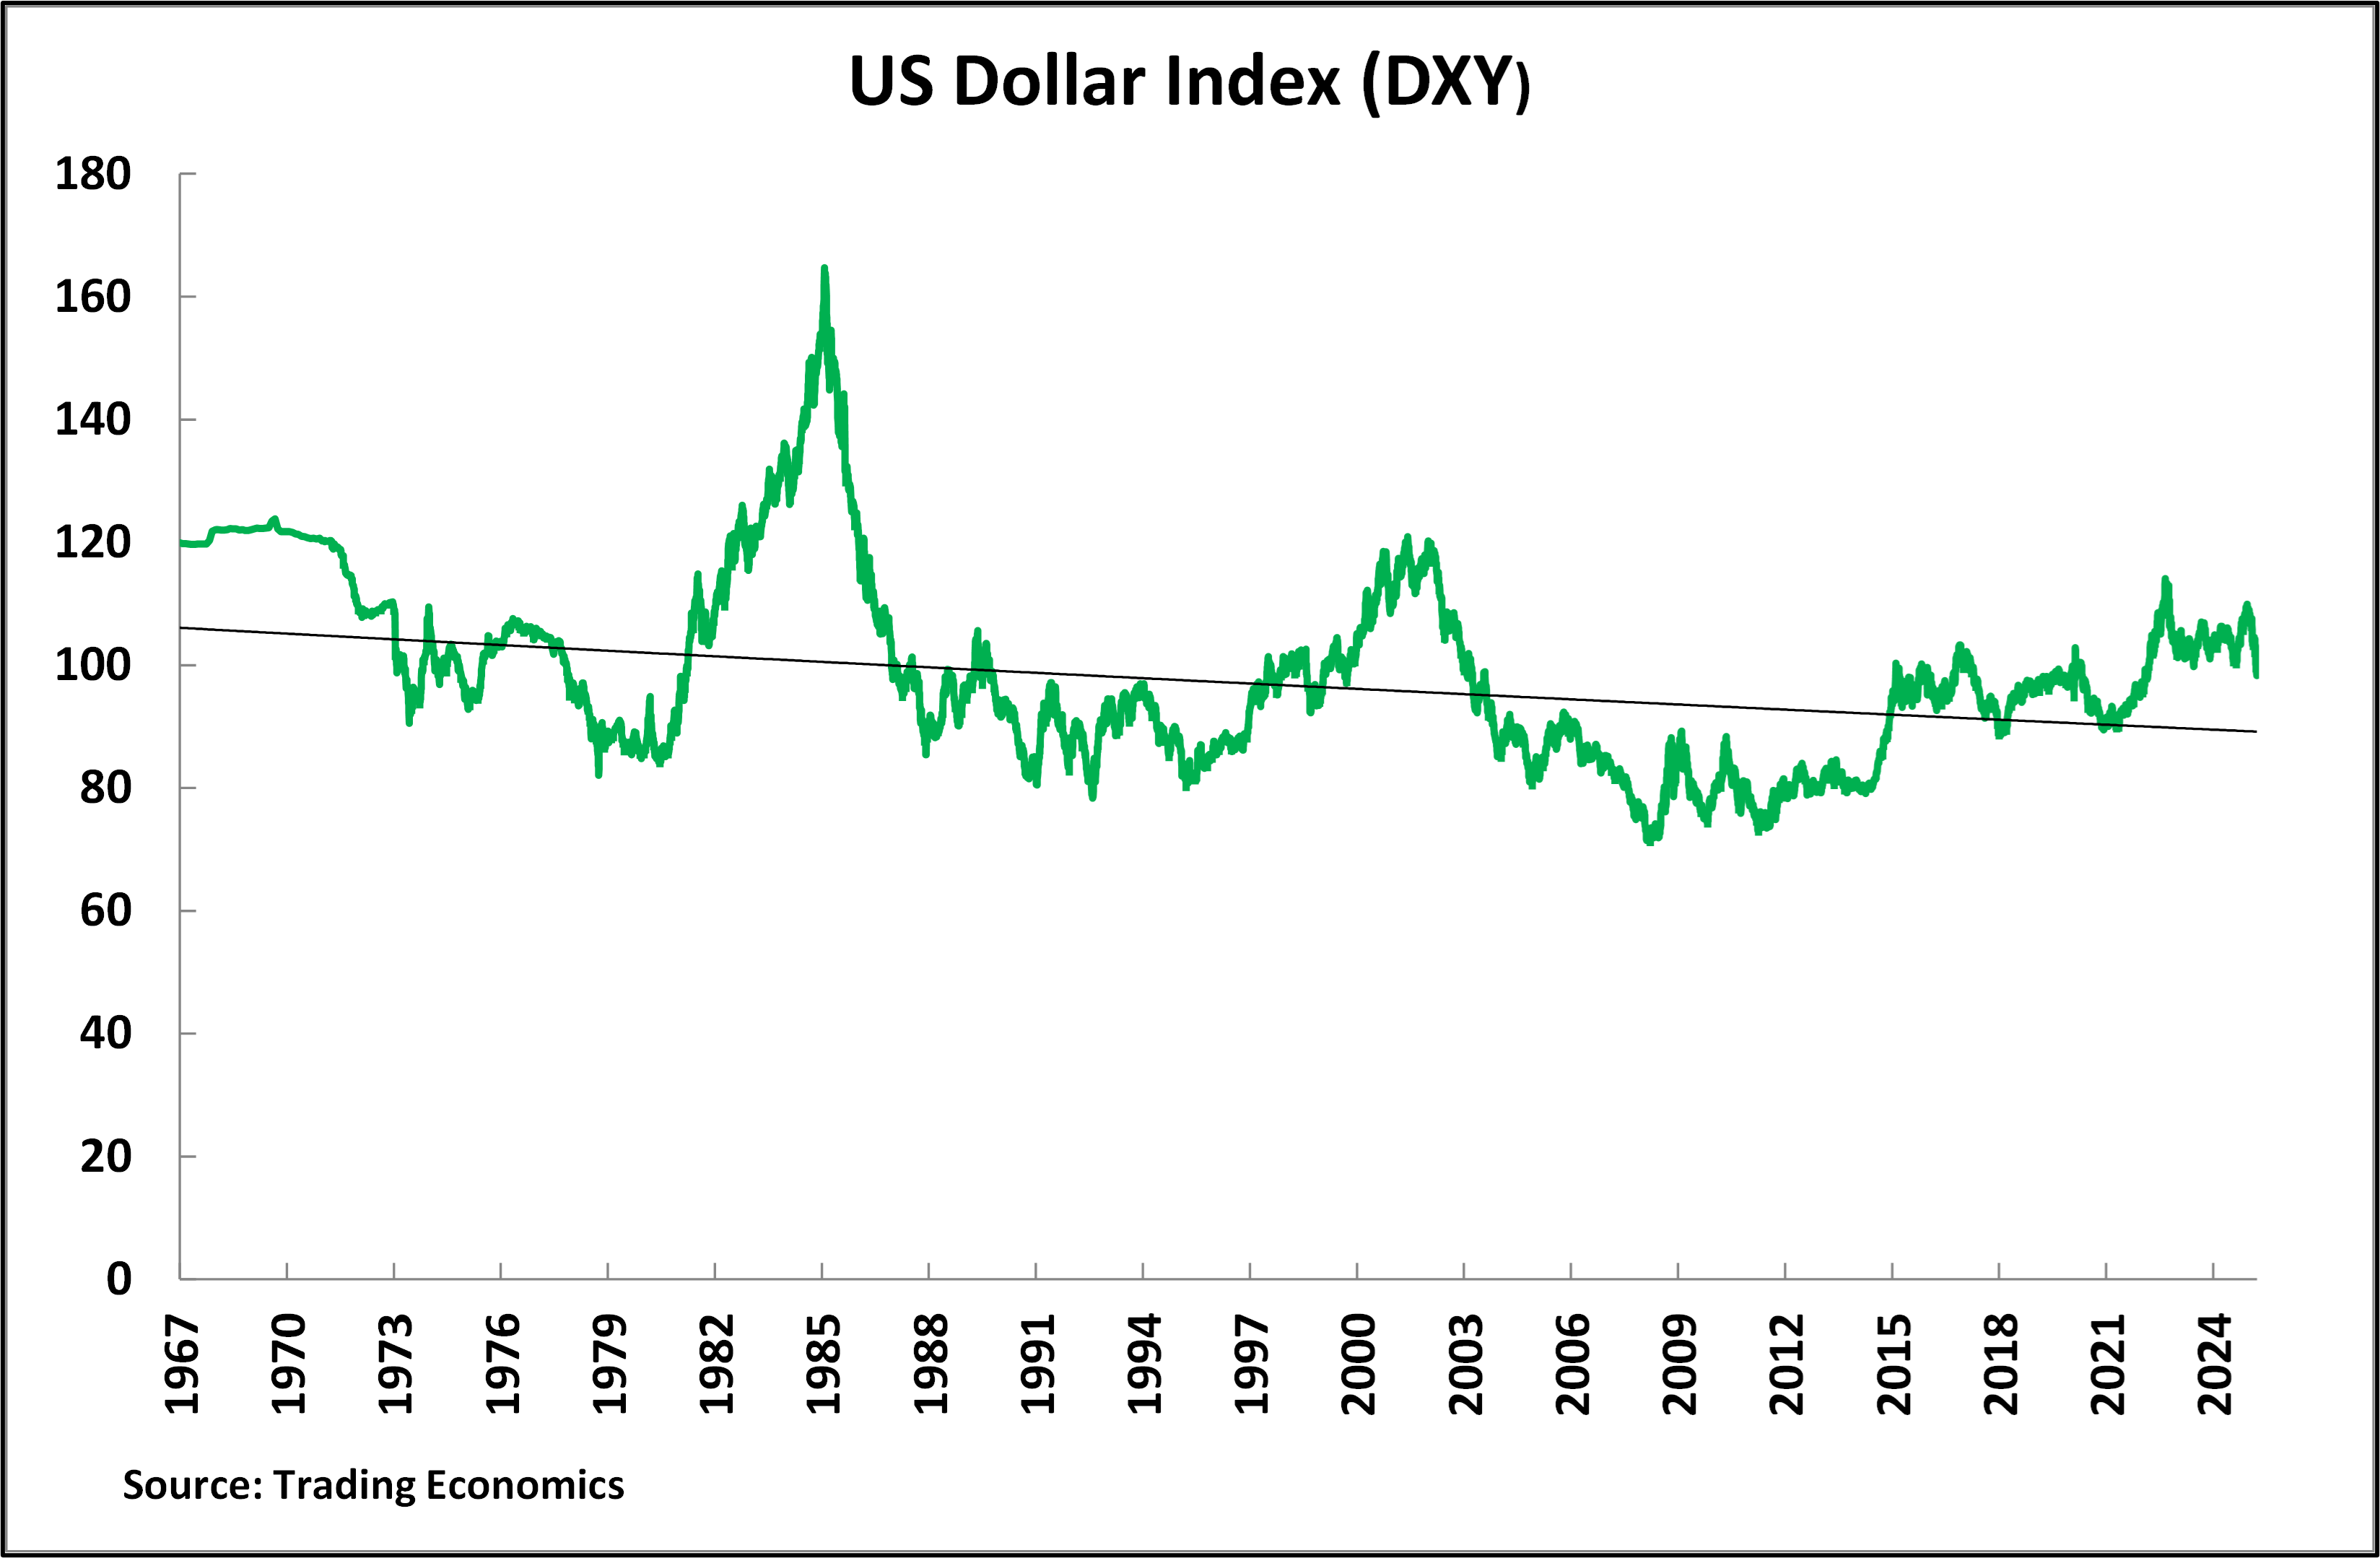
The most general trade-weighted index of the dollar’s exchange rate, DXY, was introduced by the U.S. Federal Reserve in March 1973, although it can be calculated for earlier periods. Figure 6 shows that since then, there has been a very long-term slow decline of the dollar exchange rate against major currencies, but with huge, short-, medium-, and long-term fluctuations.
Particularly relevant to the recent period since the international financial crisis, is the dollar’s role as a safe haven for countries that are not subject to U.S. sanctions - that is, in times of crisis, assets tend to move to the dollar, driving up its exchange rate. This reflects underlying economic processes and is contrary to analyses that a general trend of “de-dollarisation” is taking place in the present period – this was analysed in detail in the Guancha.cn article “去美元化”是必要的,但要从长计议
Thus, between April 2008, prior to Lehman Bother’s bankruptcy and the outbreak of the international financial crisis, and April 2022 and the end of the COVID pandemic, the dollar’s exchange rate rose by 40%, from 71 to 100.
In the three years since then, the dollar has been trading up and down in a range between 114 and 100. Most significantly, for present purposes, during the period from the end of April 2022 to April 1, 2025, its trade-weighted exchange rate did not fall below 99.8.
Figure 6
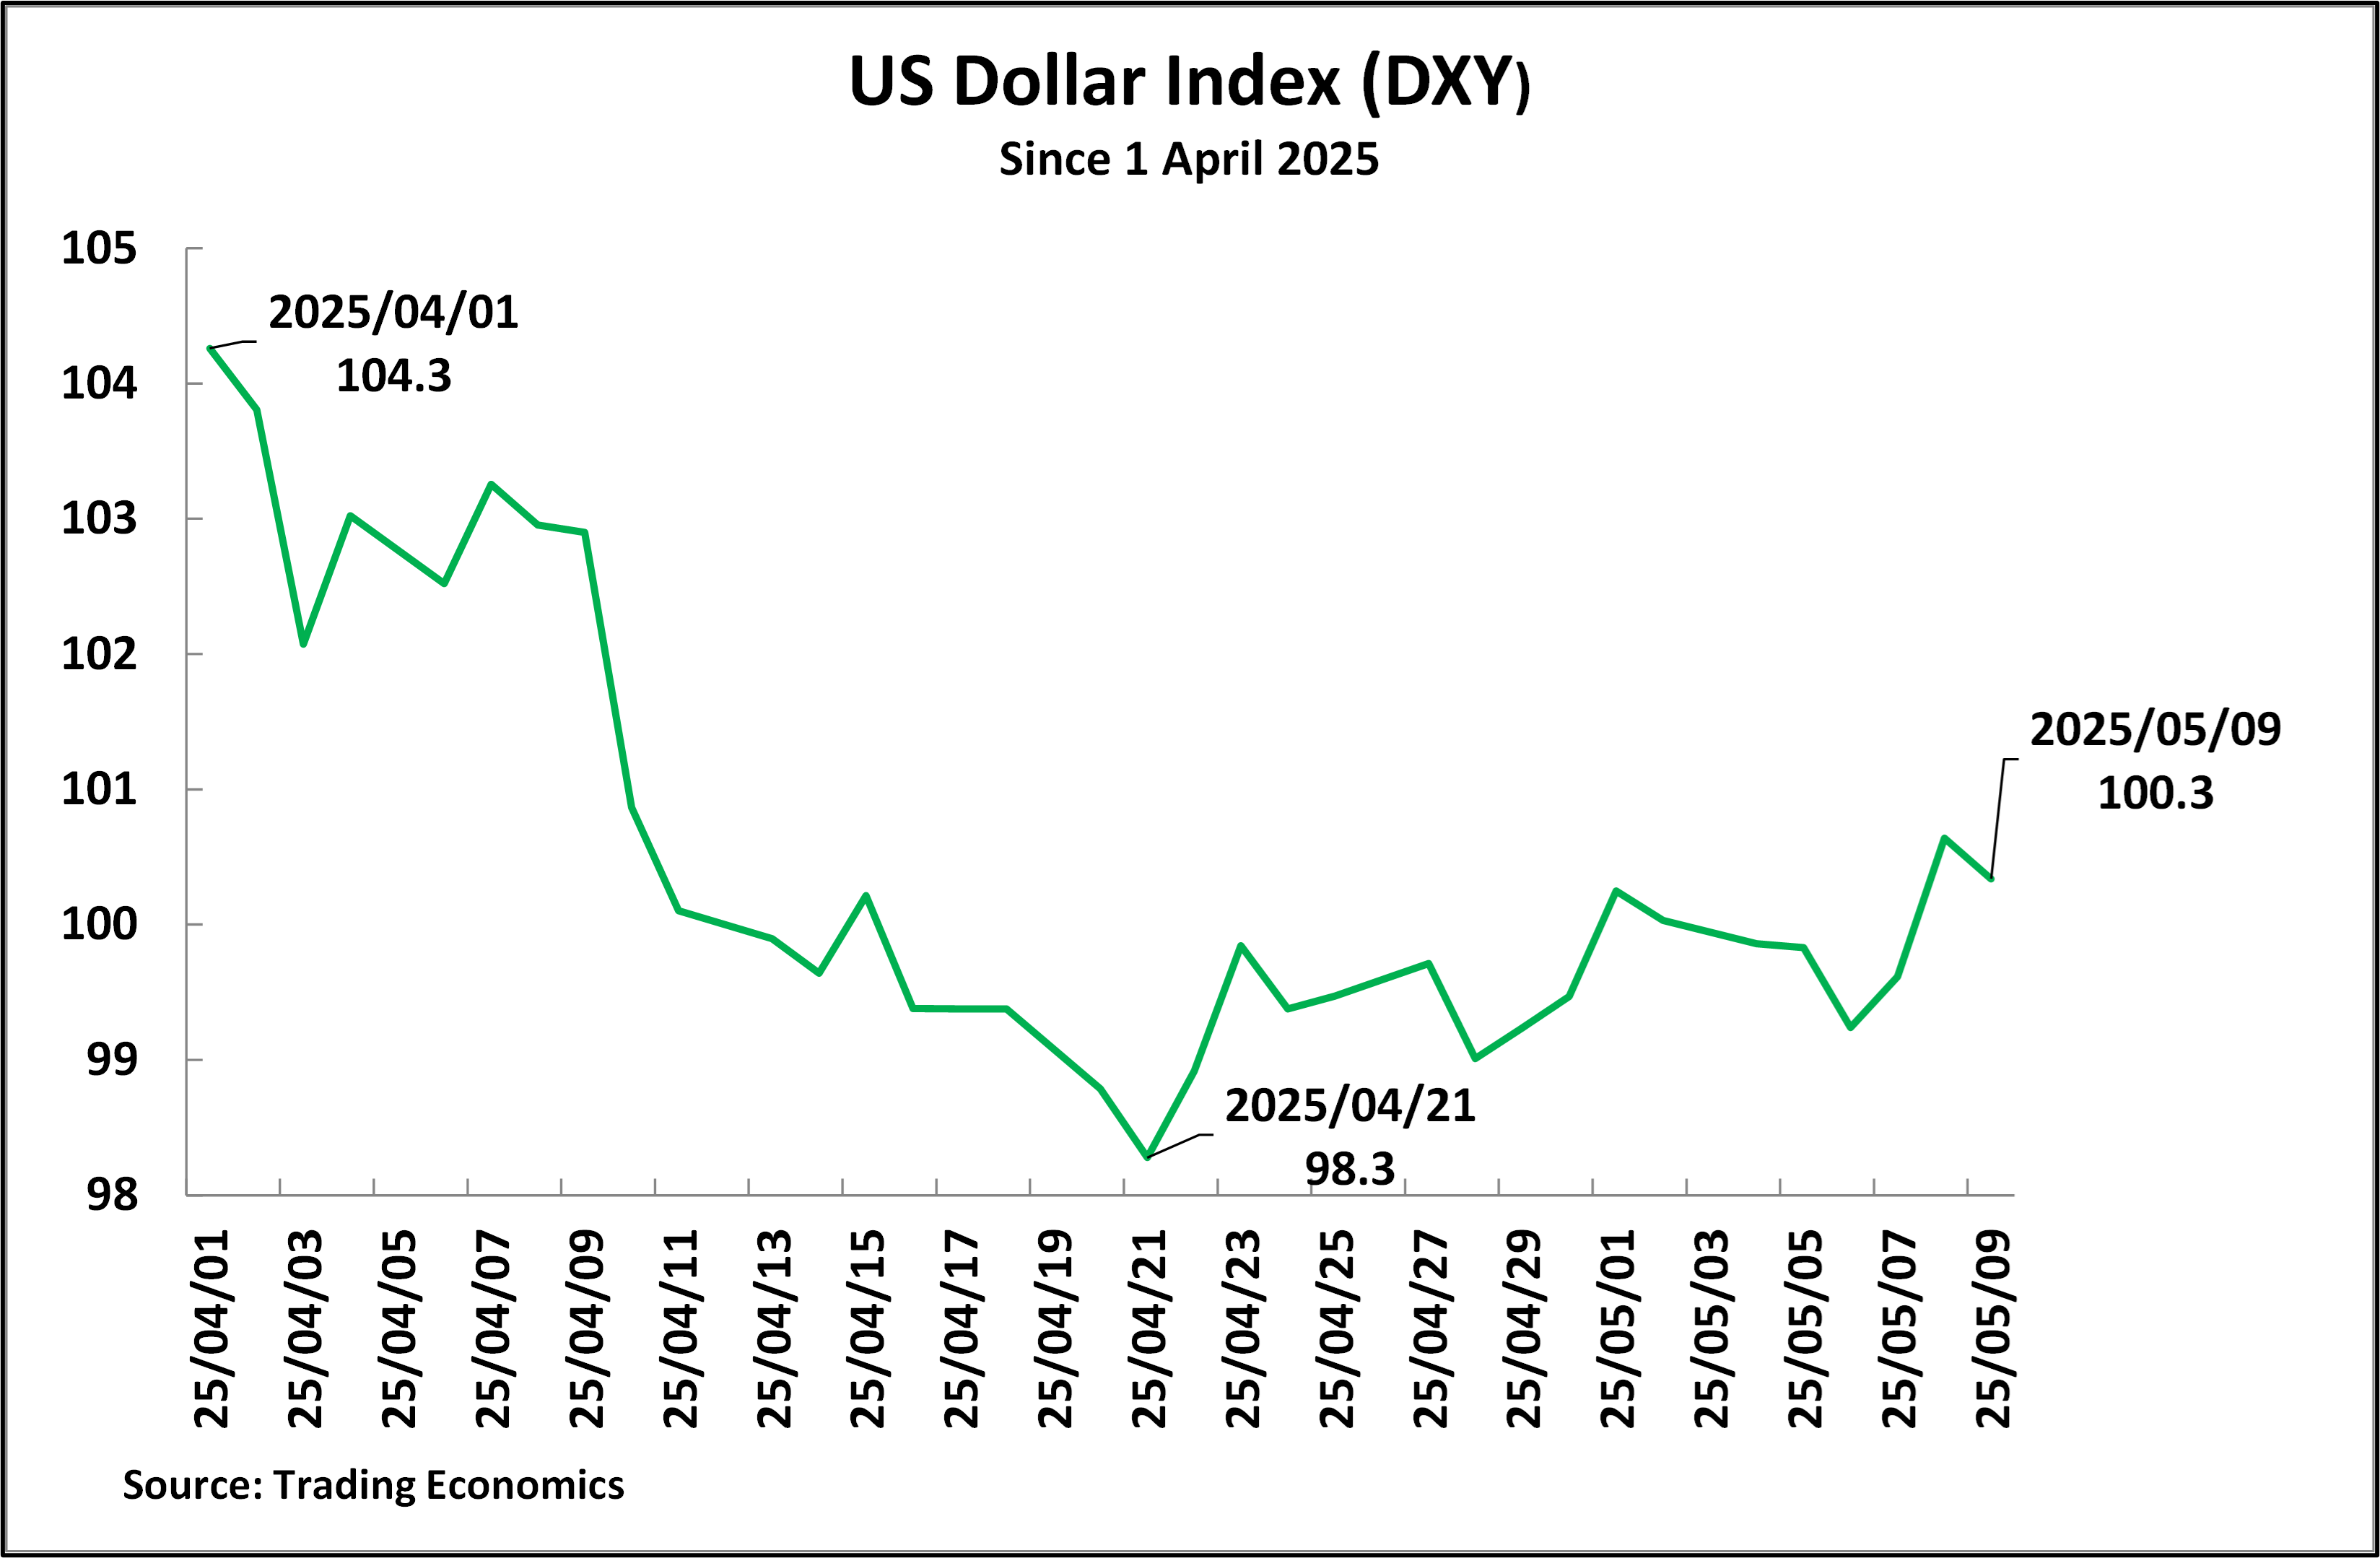
On April 1, the day before Trump’s tariff announcements, the dollar index exchange rate was 104.3 – its recent peak was 110 in January 2025.
However, Figure 7 shows that the dollar began to drop sharply after the tariff announcement on April 2. It decreased by 5.7% by April 21 to a low of 98.3. This level was significant as it broke through the bottom of the previous trading band. Trump’s tariff announcements threatened the dollar to break out of its previous trading range in a downward direction.
If this trend had been maintained, it would have been a significant development not only for financial markets, but also for economic and political conditions in the U.S. – a low dollar exchange rate would tend to produce inflationary pressures in the U.S.
However, after Trump’s tactical tariff retreat, by 1 May the dollar index recovered to 100.2 – back in its previous trading range. Trump’s tactical retreat was therefore able to limit the fall in the US dollar’s exchange rate. By May 9, the last trading day before the announcement of the 90-day U.S. – China trade agreement, the DXY was 100.3. On the last trading day at the time of writing, 23 May, the DXY was 99.1 – within the dollar’s trading range in the last three years.
In summary the movement of the dollar exchange rate so far confirms the analysis made in 特朗普在美国金融市场动荡的情况下服软是基于战术,而非战略.
Figure 7
Summary of U.S. market trends
To summarize the above developments, following the imposition of tariffs, the major U.S. financial markets showed no fluctuations outside the range of normal business cycle fluctuations. It is not crucial for present purposes whether this was because Trump partially retreated after his initial announcement of tariffs to keep market fluctuations within normal bounds, in particular postponing the imposition of “reciprocal tariffs” against countries for 90 days, or whether market fluctuations would not have gone outside normal bounds even if Trump had made no such partial retreat – the former case merely means that Trump’s decisions are carried out only within the framework of what the financial markets will accept. What determines the situation is not Trump’s motivations or reasoning but objective developments. What is important is that developments in U.S. financial markets after tariff announcements showed no changes outside normal business cycle fluctuations. That is, neither a “manic” nor a “depressive” analysis of the situation of the U.S. economy was justified by such data.
There is therefore no reason to believe, from the indication of trends within the U.S. economy, that there will be a rapid crisis in the U.S. economy and therefore that there will be any rapid resolution of the competition between China and the U.S. due to any such crisis. This is why if in the last several years, it was necessary to reject exaggerated claims, based on a purely normal upturn in the business cycle, that there was a great “boom” in the U.S. economy now it is equally crucial to reject any perspective that there is a deep “crisis” in the U.S. economy – i.e. both “manic” and the “depressive” views of the U.S. economy are incorrect.
Part 2 - The real tend in the U.S. economy
Turning from the impressionist analysis in the U.S. media, to the real situation of the U.S. economy, then if there is not going to be a short-term outcome of the competitive struggle between the U.S. and China what are the forces that will determine the long-term outcome? This analysis must clearly be based on the real situation of the U.S. economy and the facts regarding its most powerful forces.
U.S. GDP data
So far, the trends in U.S. financial markets have been examined as, while these give only partial data, this is the most up to date regarding the situation of the U.S. economy following the announcement of Trump’s tariffs. In contrast, production figures always have a slight delay of a few weeks, and therefore, at the time of writing, they are not available for April. However, U.S. GDP data are available for the first quarter of 2025, covering the period up to the end of March. These data confirm that there were no processes taking place within the U.S. economy that were outside the range of normal fluctuations in the period immediately preceding the introduction of tariffs.
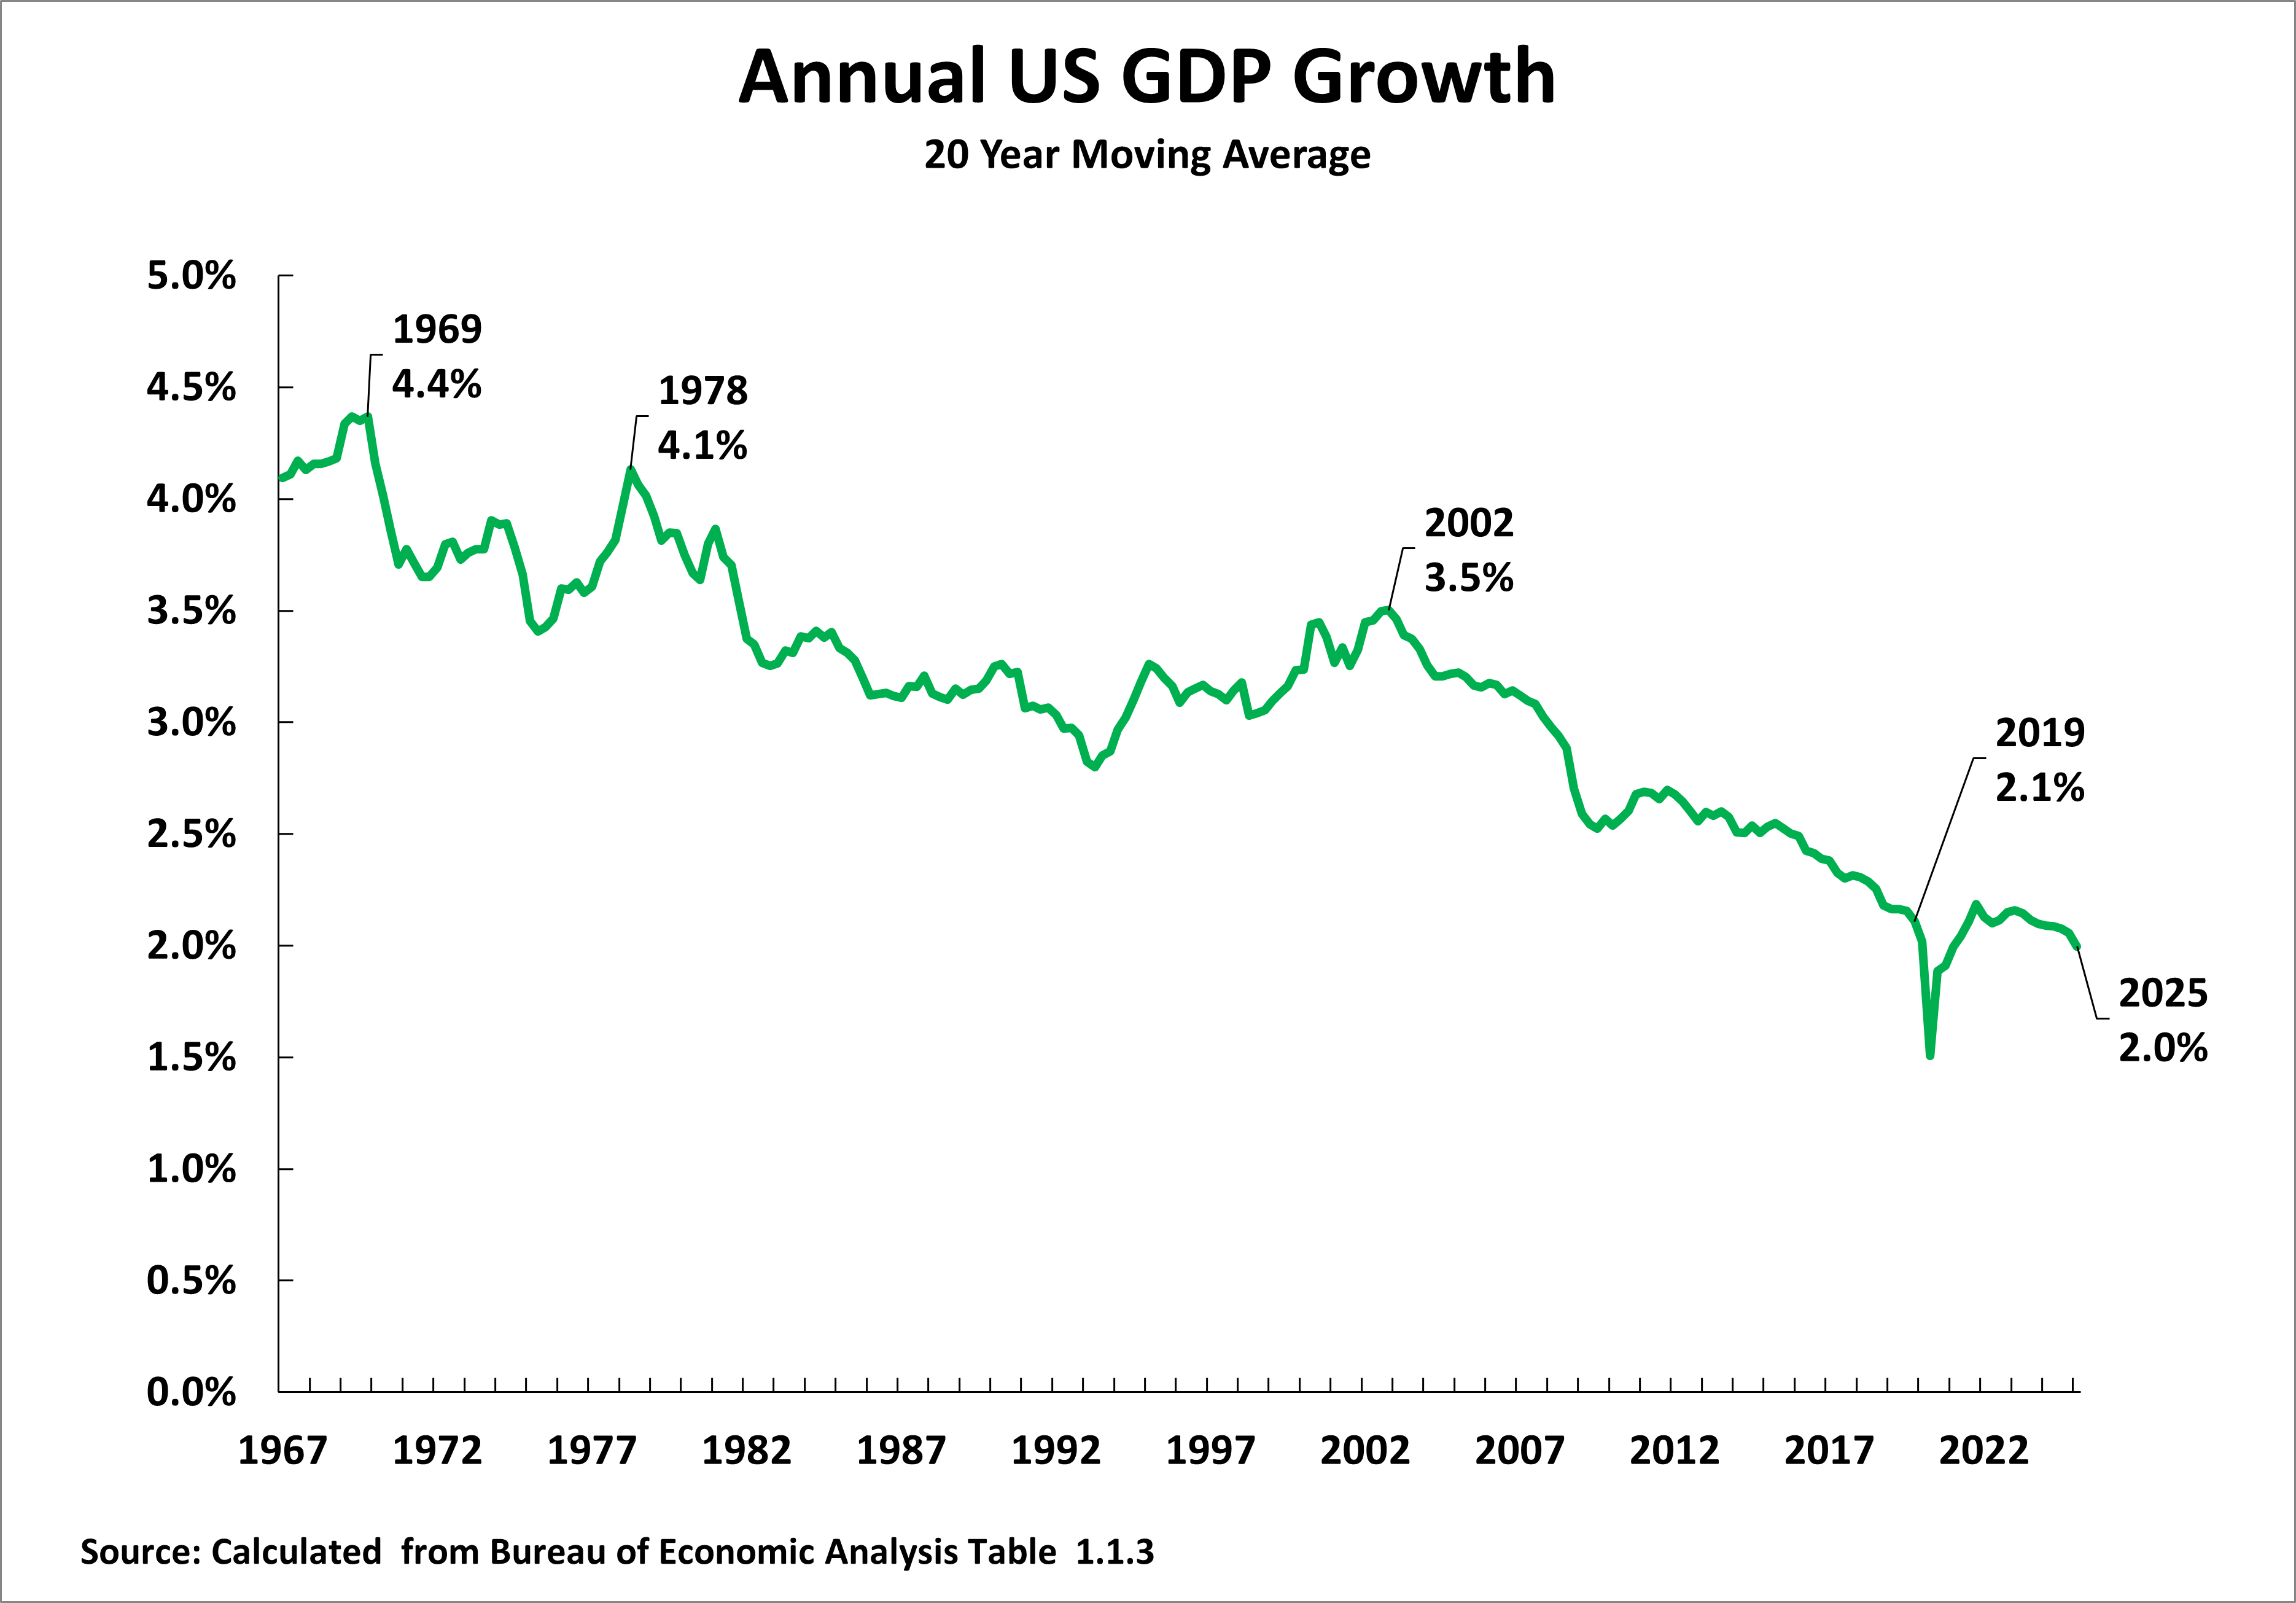
Taking U.S. GDP data, Figure 8 shows that the overwhelmingly strong trend in U.S. economic growth is a gradual slowdown that has been continuing for almost six decades. The annual average U.S. GDP growth rate, taking a long-term moving average to remove the effect of short-term business cycle fluctuations, has more than halved in that period, declining from 4.4% in 1969 to 3.5% by 2002 and 2.0% by the latest data for the first quarter of 2025.
Figure 8
A normal business cycle slowdown
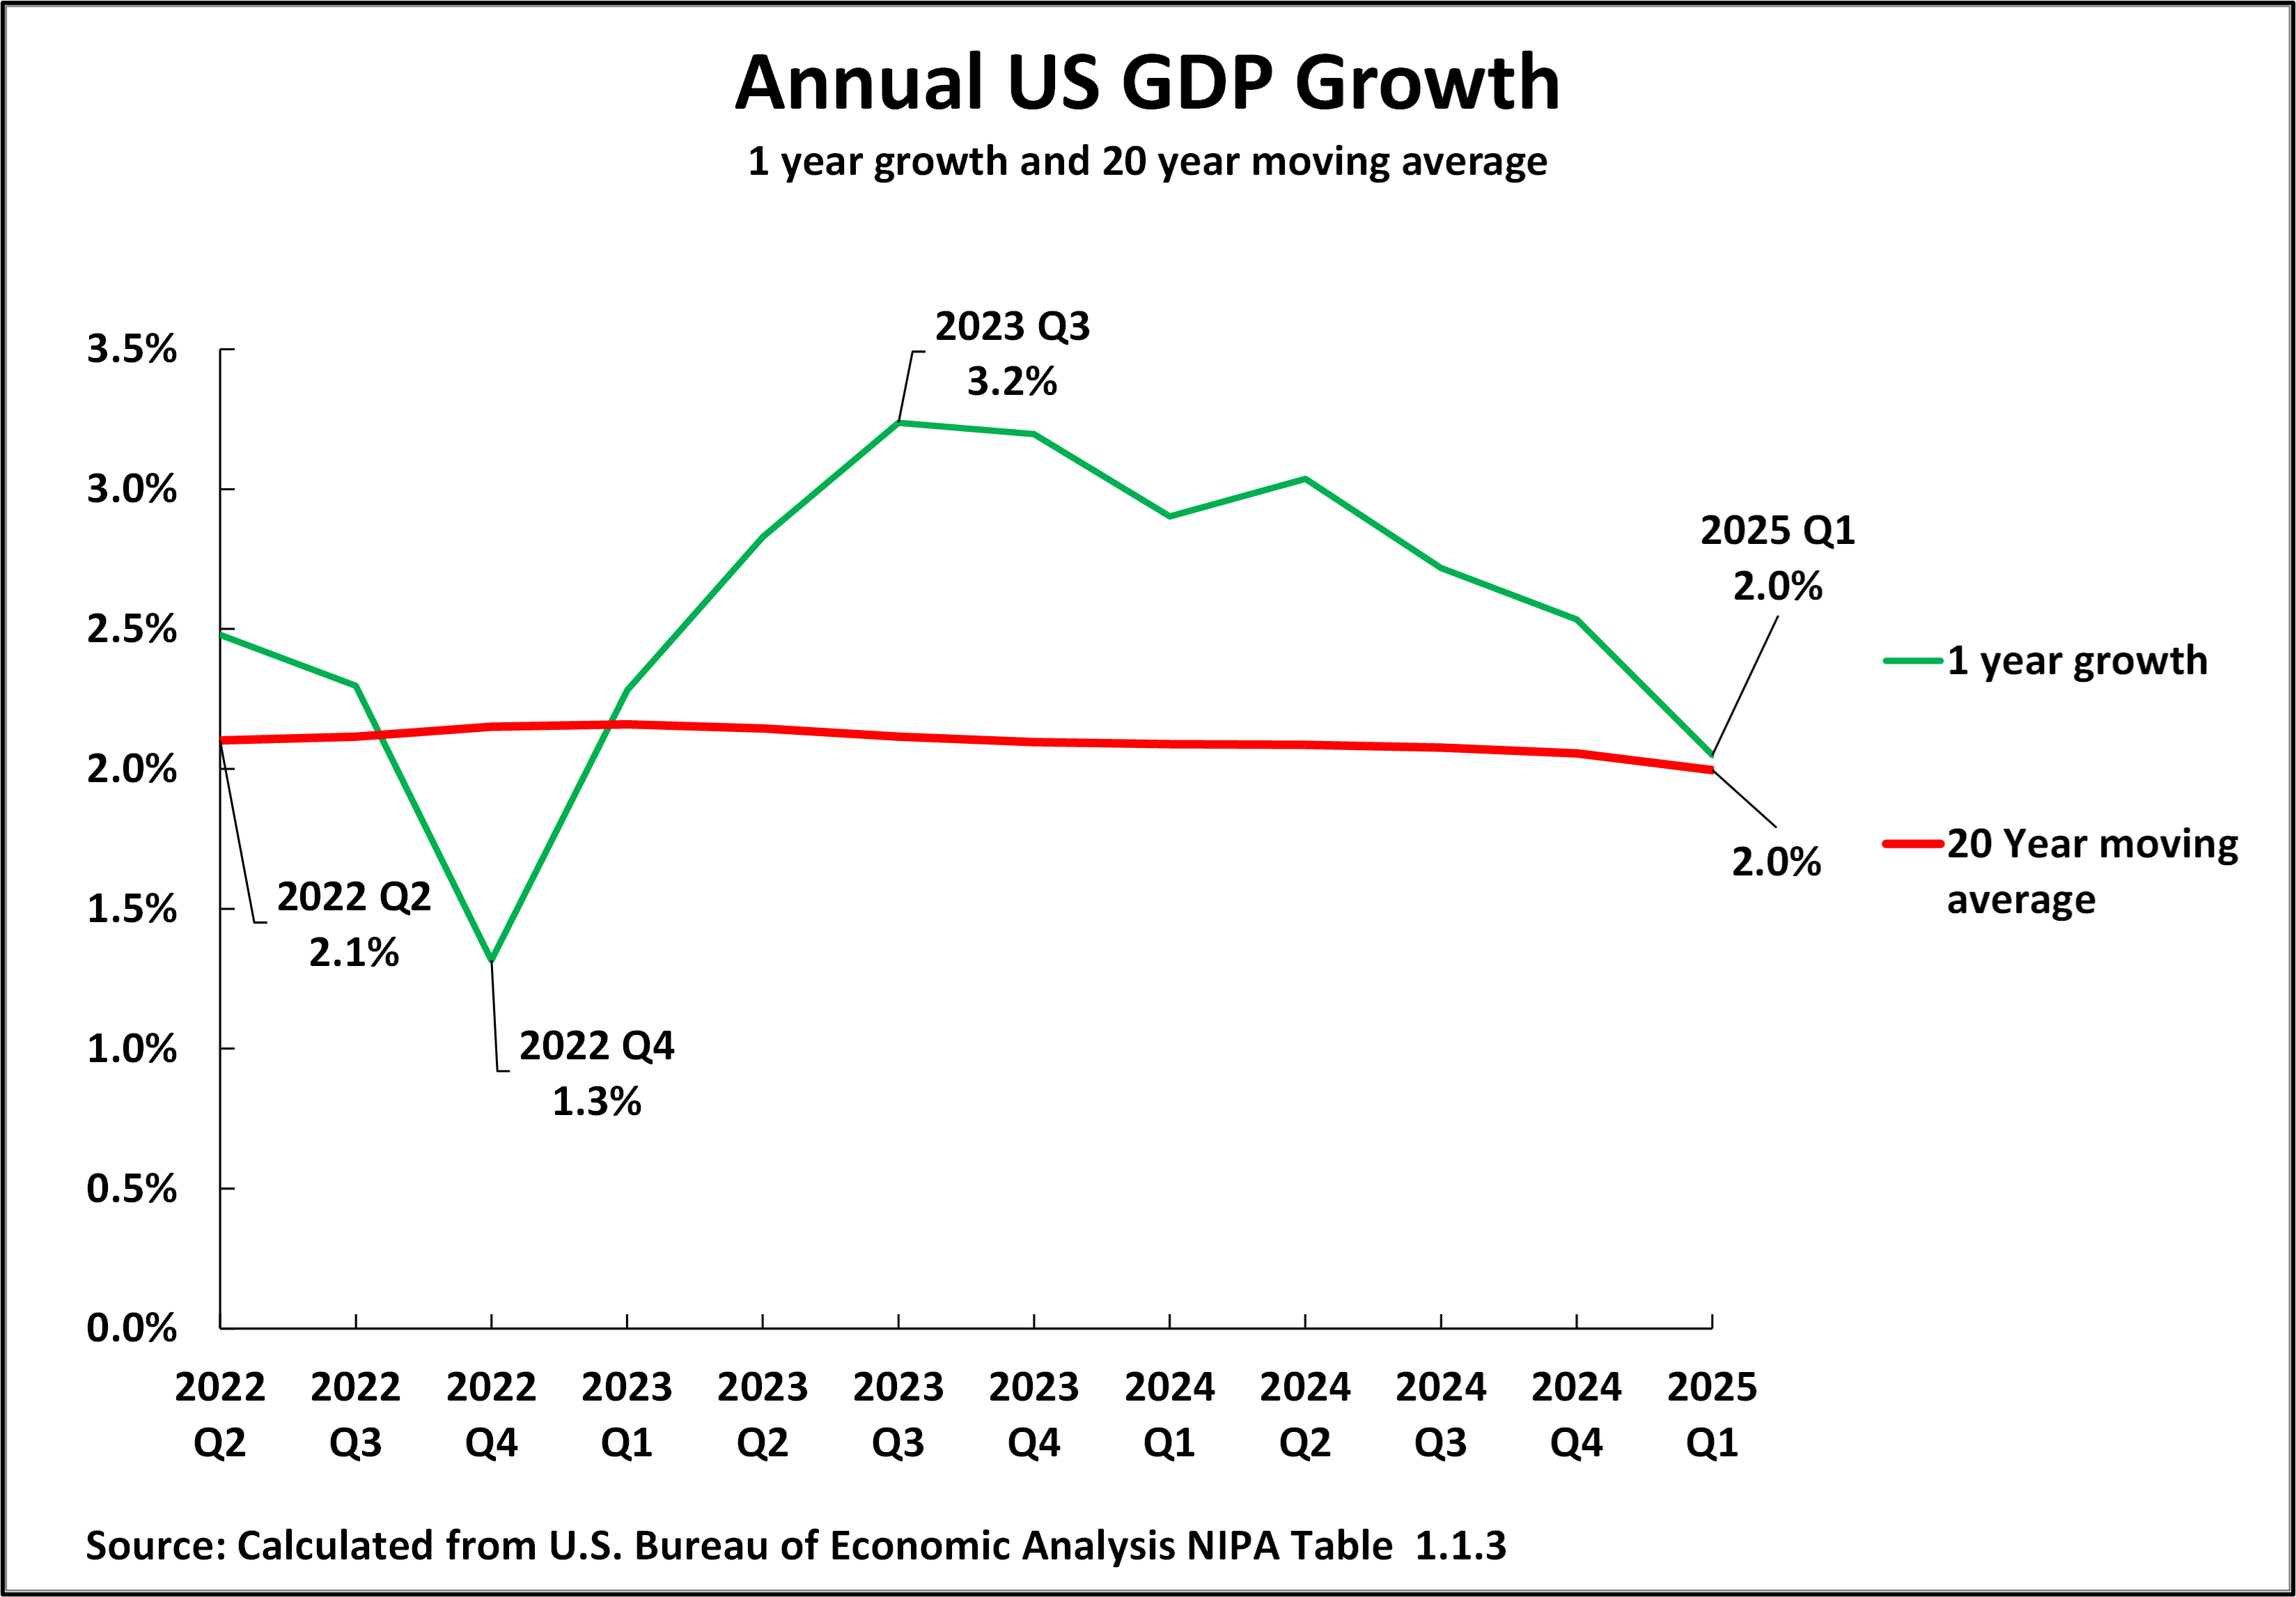
To accurately understand U.S. economic trends, it should be noted that normal business cycle fluctuations periodically take U.S. short-term growth alternately above and below this long-term growth rate. Figure 9 shows that this is precisely what occurred after the U.S. emerged from the short-term fluctuations caused by the Covid pandemic. The long-term U.S. annual GDP growth rate during this recent period, up to 2025, fell very slightly from 2.1% to 2.0%. In contrast, as would be expected, year-on-year U.S. annual GDP growth rates showed a fairly wide band of fluctuations, of 1.9% - ranging from 1.3% in the 4th quarter of 2022, well below the U.S. long-term growth rate, before rising to 3.2%, well above its long-term growth rate, in the 2nd quarter of 2022. The year-on-year U.S. GDP growth then fell progressively to the latest data for 2.0% in the first quarter of 2025, almost exactly in line with the U.S.’s long-term growth rate.
In short, all that occurred in these U.S. fluctuations since Covid was a short-term business cycle movement around the very slowly declining long-term growth rate that has been going on for six decades. There were no fluctuations outside the normal range for the U.S. business cycles.
In summary, neither of the current market fluctuations considered above, nor in the output data, is there anything that justifies a “manic depressive” analysis, of either a great boom or a great crash, regarding the U.S. economy - neither in recent years has the U.S. been undergoing a strong “boom” nor does it today face a deep “crisis”. All that is occurring is that the U.S. is experiencing business cycle fluctuations around a slowly declining average annual growth rate of slightly above two percent a year. There is no factual evidence that anything except this process is taking place.
Therefore, while the possibility of some deep slowdown in the U.S. economy cannot be totally excluded, for example, due to some very serious policy mistakes, it would be extremely unwise to base the analysis of the situation on such a possibility. The overwhelming evidence is that the U.S. is simply experiencing normal business cycle fluctuations around a growth rate of slightly over two percent per year. Consequently, the central case from an economic perspective should be that this will continue.
Figure 9
What would cause a major shift in the U.S. economy?
Turning to what factors determine the U.S. economy’s medium/long term growth rate, a detailed analysis of these was given in 想知道特朗普的中国策略,先要明白美国经济衰退的真相. Therefore, only the most fundamental trends and determining forces are presented here.
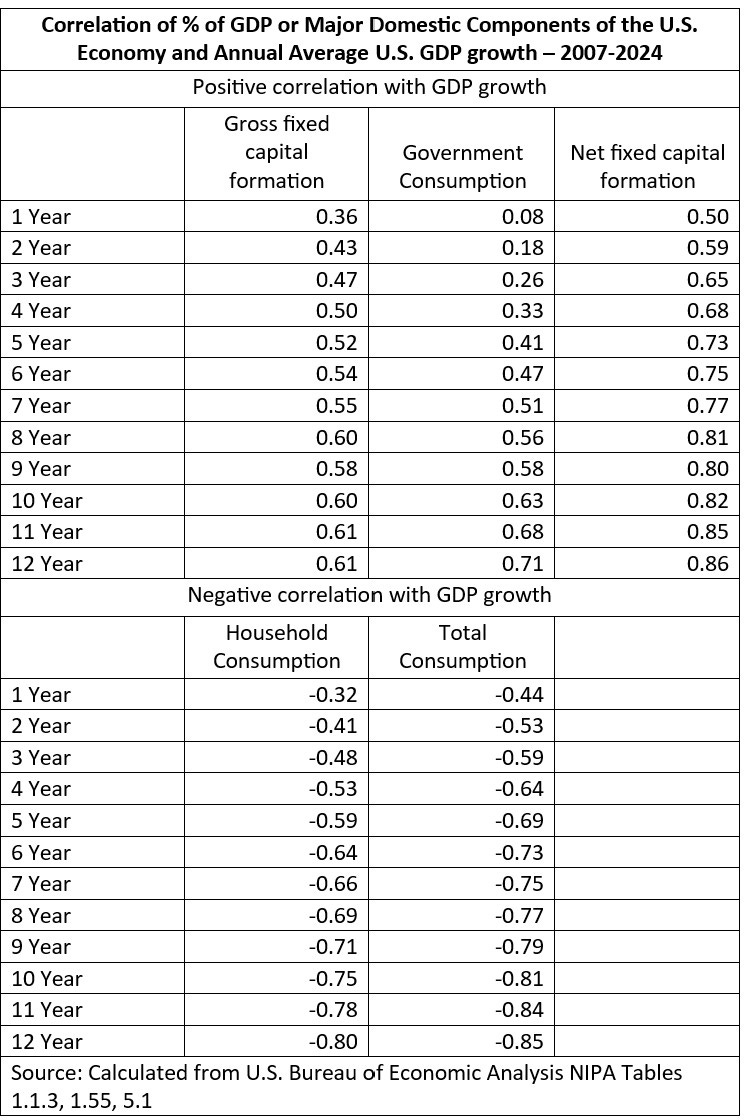
First, regarding the U.S. economy itself, Table 1 shows the relationship between the percentage of the major components of the U.S. economy in terms of the structure of GDP and the U.S. annual average GDP growth rate over the short, medium, and long terms. This pattern is extremely clear. As can be seen, in the short term, the correlations between U.S. GDP growth and the percentage of major components of the U.S. economy is at best moderate and, in most cases, low. The highest correlation over a one-year period is 0.50, between the percentage of net fixed capital formation in GDP and GDP growth. This means that, in the short term, numerous factors influence U.S. GDP growth, and no single factor plays a determining role..
By the medium term, in contrast, some correlations between the percentages of major components of U.S. GDP and its economic growth rate have become high or close to high. Taking a five-year period, the positive correlation between the percentage of net fixed capital formation in GDP and GDP growth has become a high 0.73, and the negative correlation between the percentage of consumption in GDP and GDP growth has become 0.69.
Taking the long term, some of the correlations rise to extremely high, making it impossible to avoid their consequences. In particular, the positive correlation between the percentage of net fixed capital formation in GDP and GDP growth was 0.86, and the negative correlation between the percentage of consumption in GDP and annual GDP growth was 0.85. This means that, considering the long run, any increase in the U.S. GDP growth rate can only be achieved if there is an increase in the percentage of net fixed capital formation in U.S. GDP, any decrease in the percentage of net fixed capital formation in U.S. GDP will be accompanied by a fall in the U.S. economic growth rate, and any increase in the percentage of consumption in the U.S. will be accompanied by a slowdown in the U.S. economy.
Summarizing these trends, they mean that, in the short term, numerous short-term factors influence U.S. GDP growth, but that these are superimposed on a long-term trend that is dominated positively by the percentage of net fixed capital formation in the U.S. and negatively by the percentage of consumption in U.S. GDP.
Table 1
The longer term relation of the percentage of net fixed capital formation in U.S. GDP and the U.S. GDP growth rate
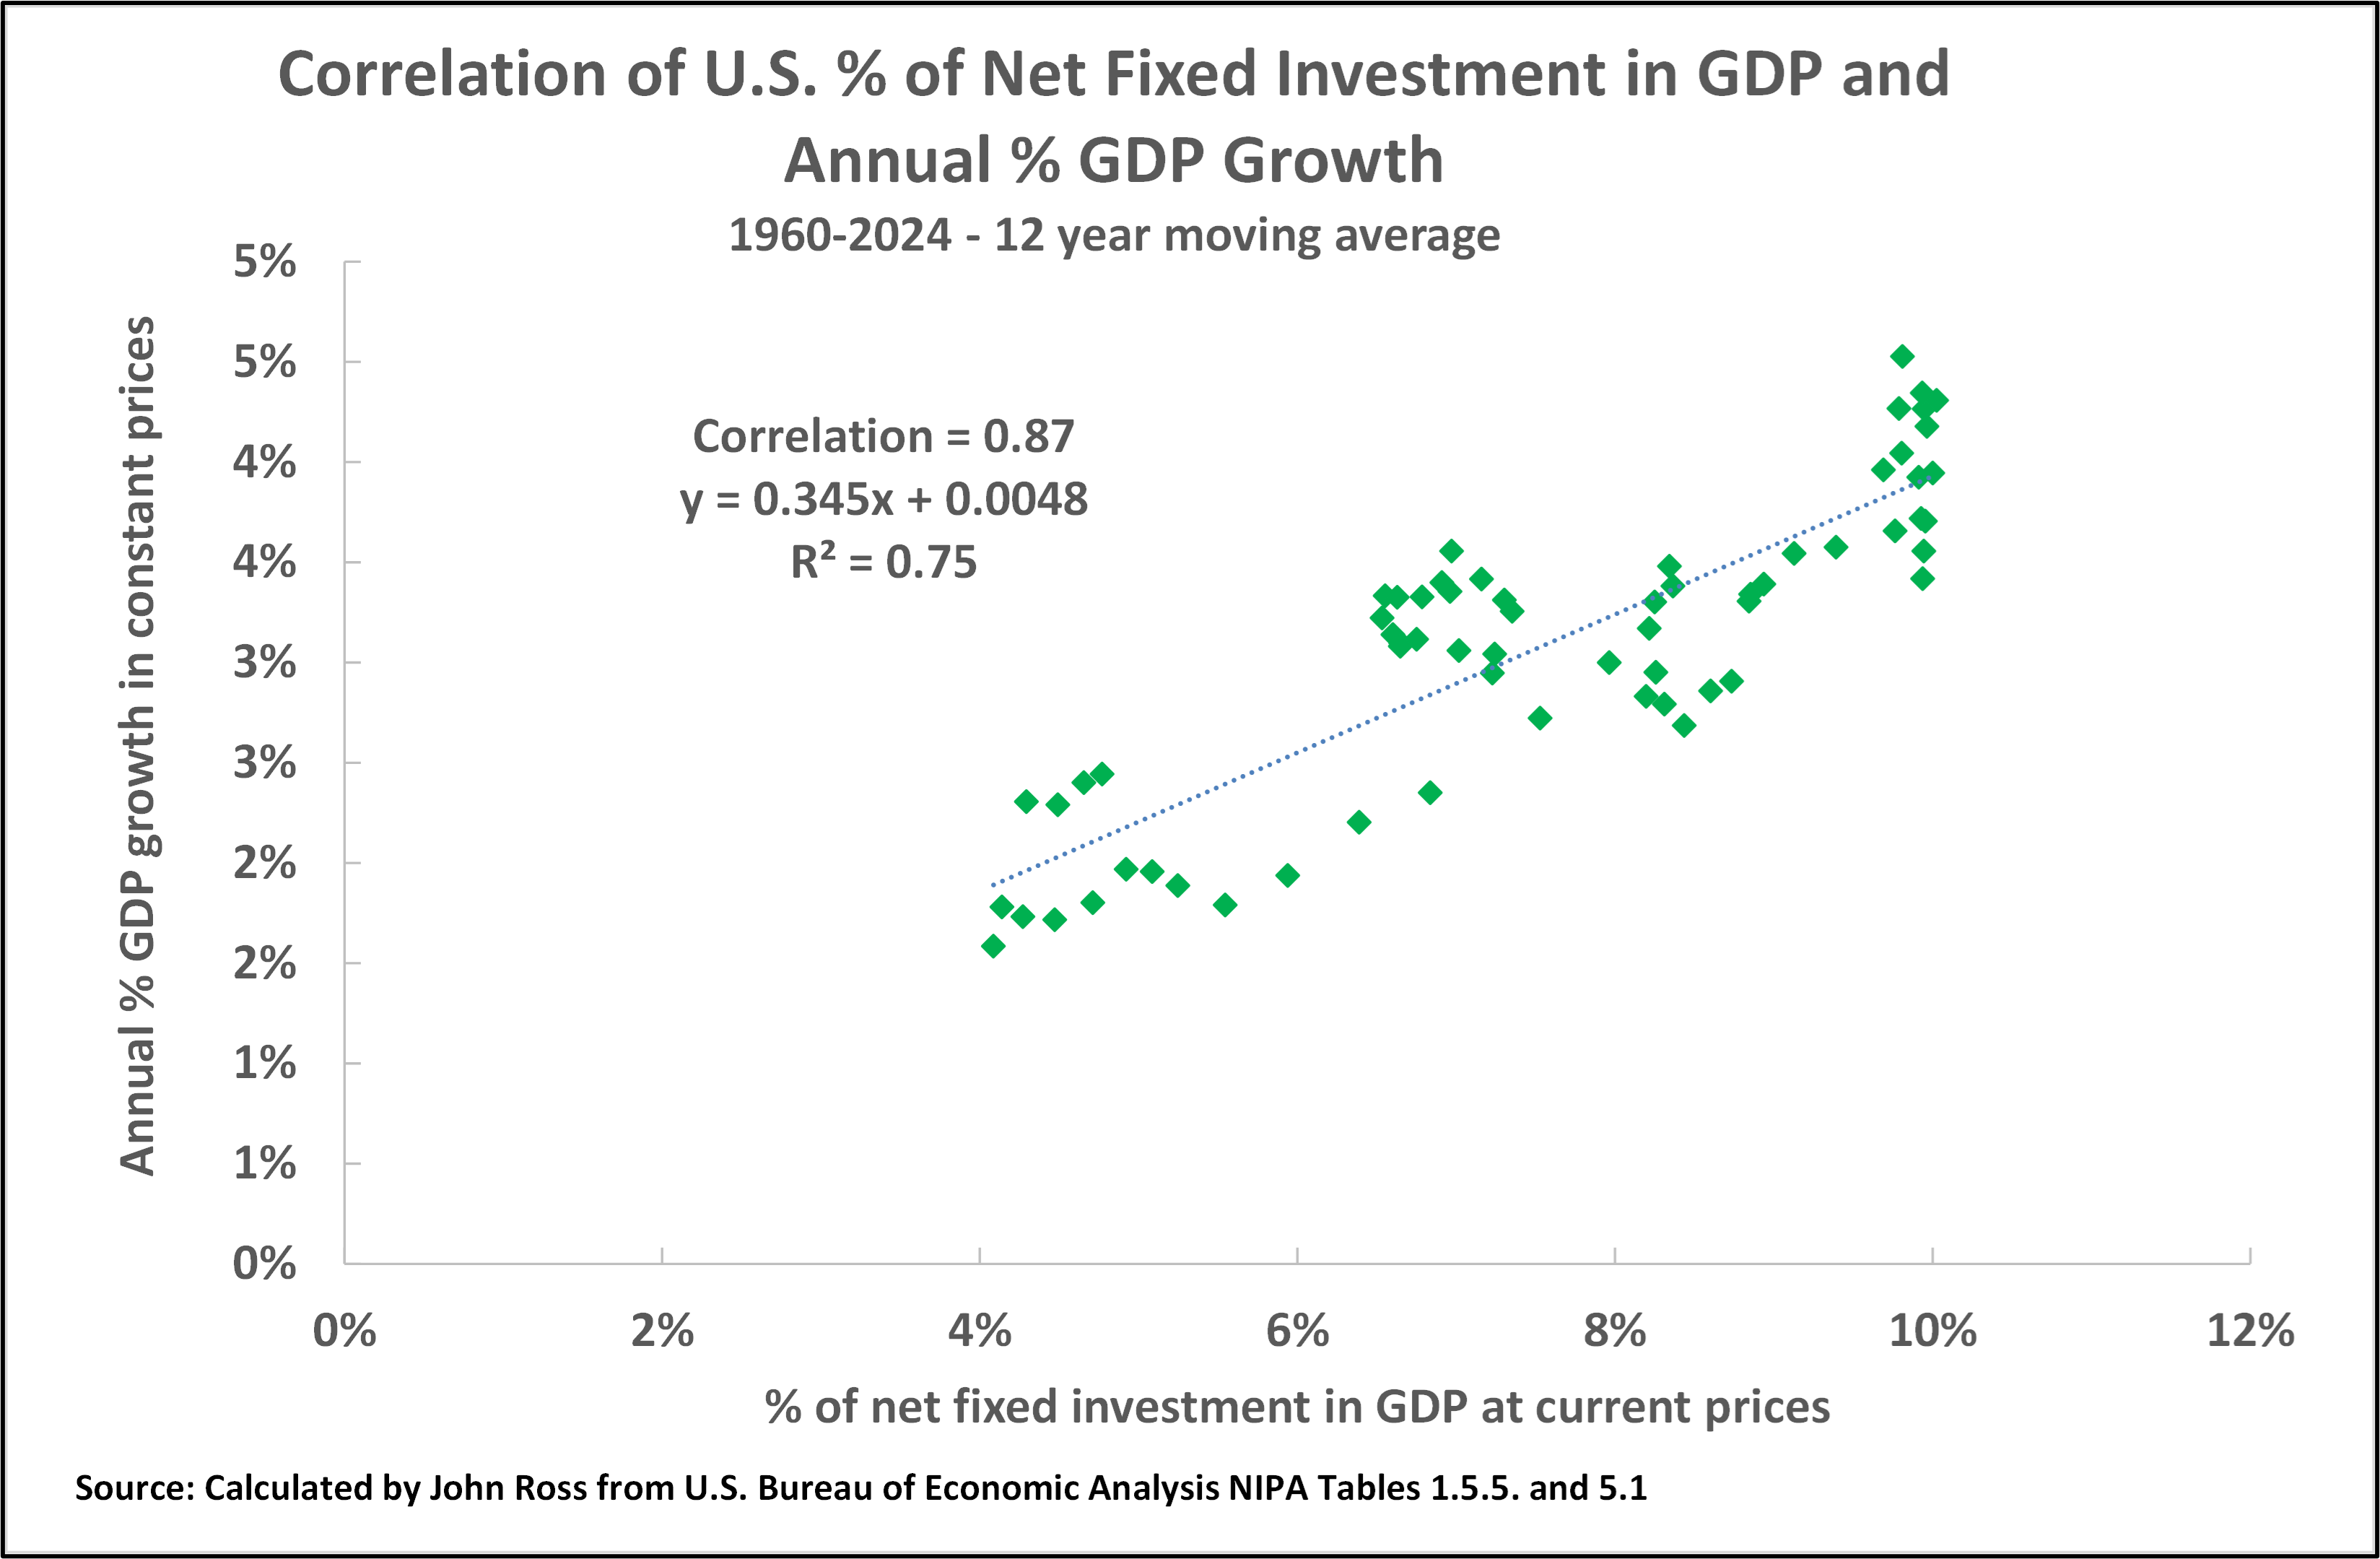
By far, the strongest of these positive relations to U.S. economic growth is that for the percentage of net fixed capital formation in GDP. To analyse the very long term, the extremely strong positive correlation between the long-term percentage of net fixed investment in U.S. GDP and U.S. GDP growth is fully confirmed in Figure 10, which takes the entire period of U.S. economic development since 1960, that is, over a 64 year period. As can be seen, the long-term correlation between the percentage of net fixed investment in GDP and annual U.S. GDP growth is extremely high, at 0.86.
Figure 10
The current trend in net fixed capital formation in U.S. GDP
Given this extremely close correlation between the percentage of net fixed capital formation in GDP and U.S. GDP growth, a decrease in the percentage of net fixed capital formation in U.S. GDP would be accompanied by a slowdown in U.S. GDP growth and without a fall in the percentage of net fixed capital formation in U.S. GDP, there would not be a fall in U.S. GDP growth. This relationship is confirmed by this six-decade-long period of slowdown in the U.S. economy.
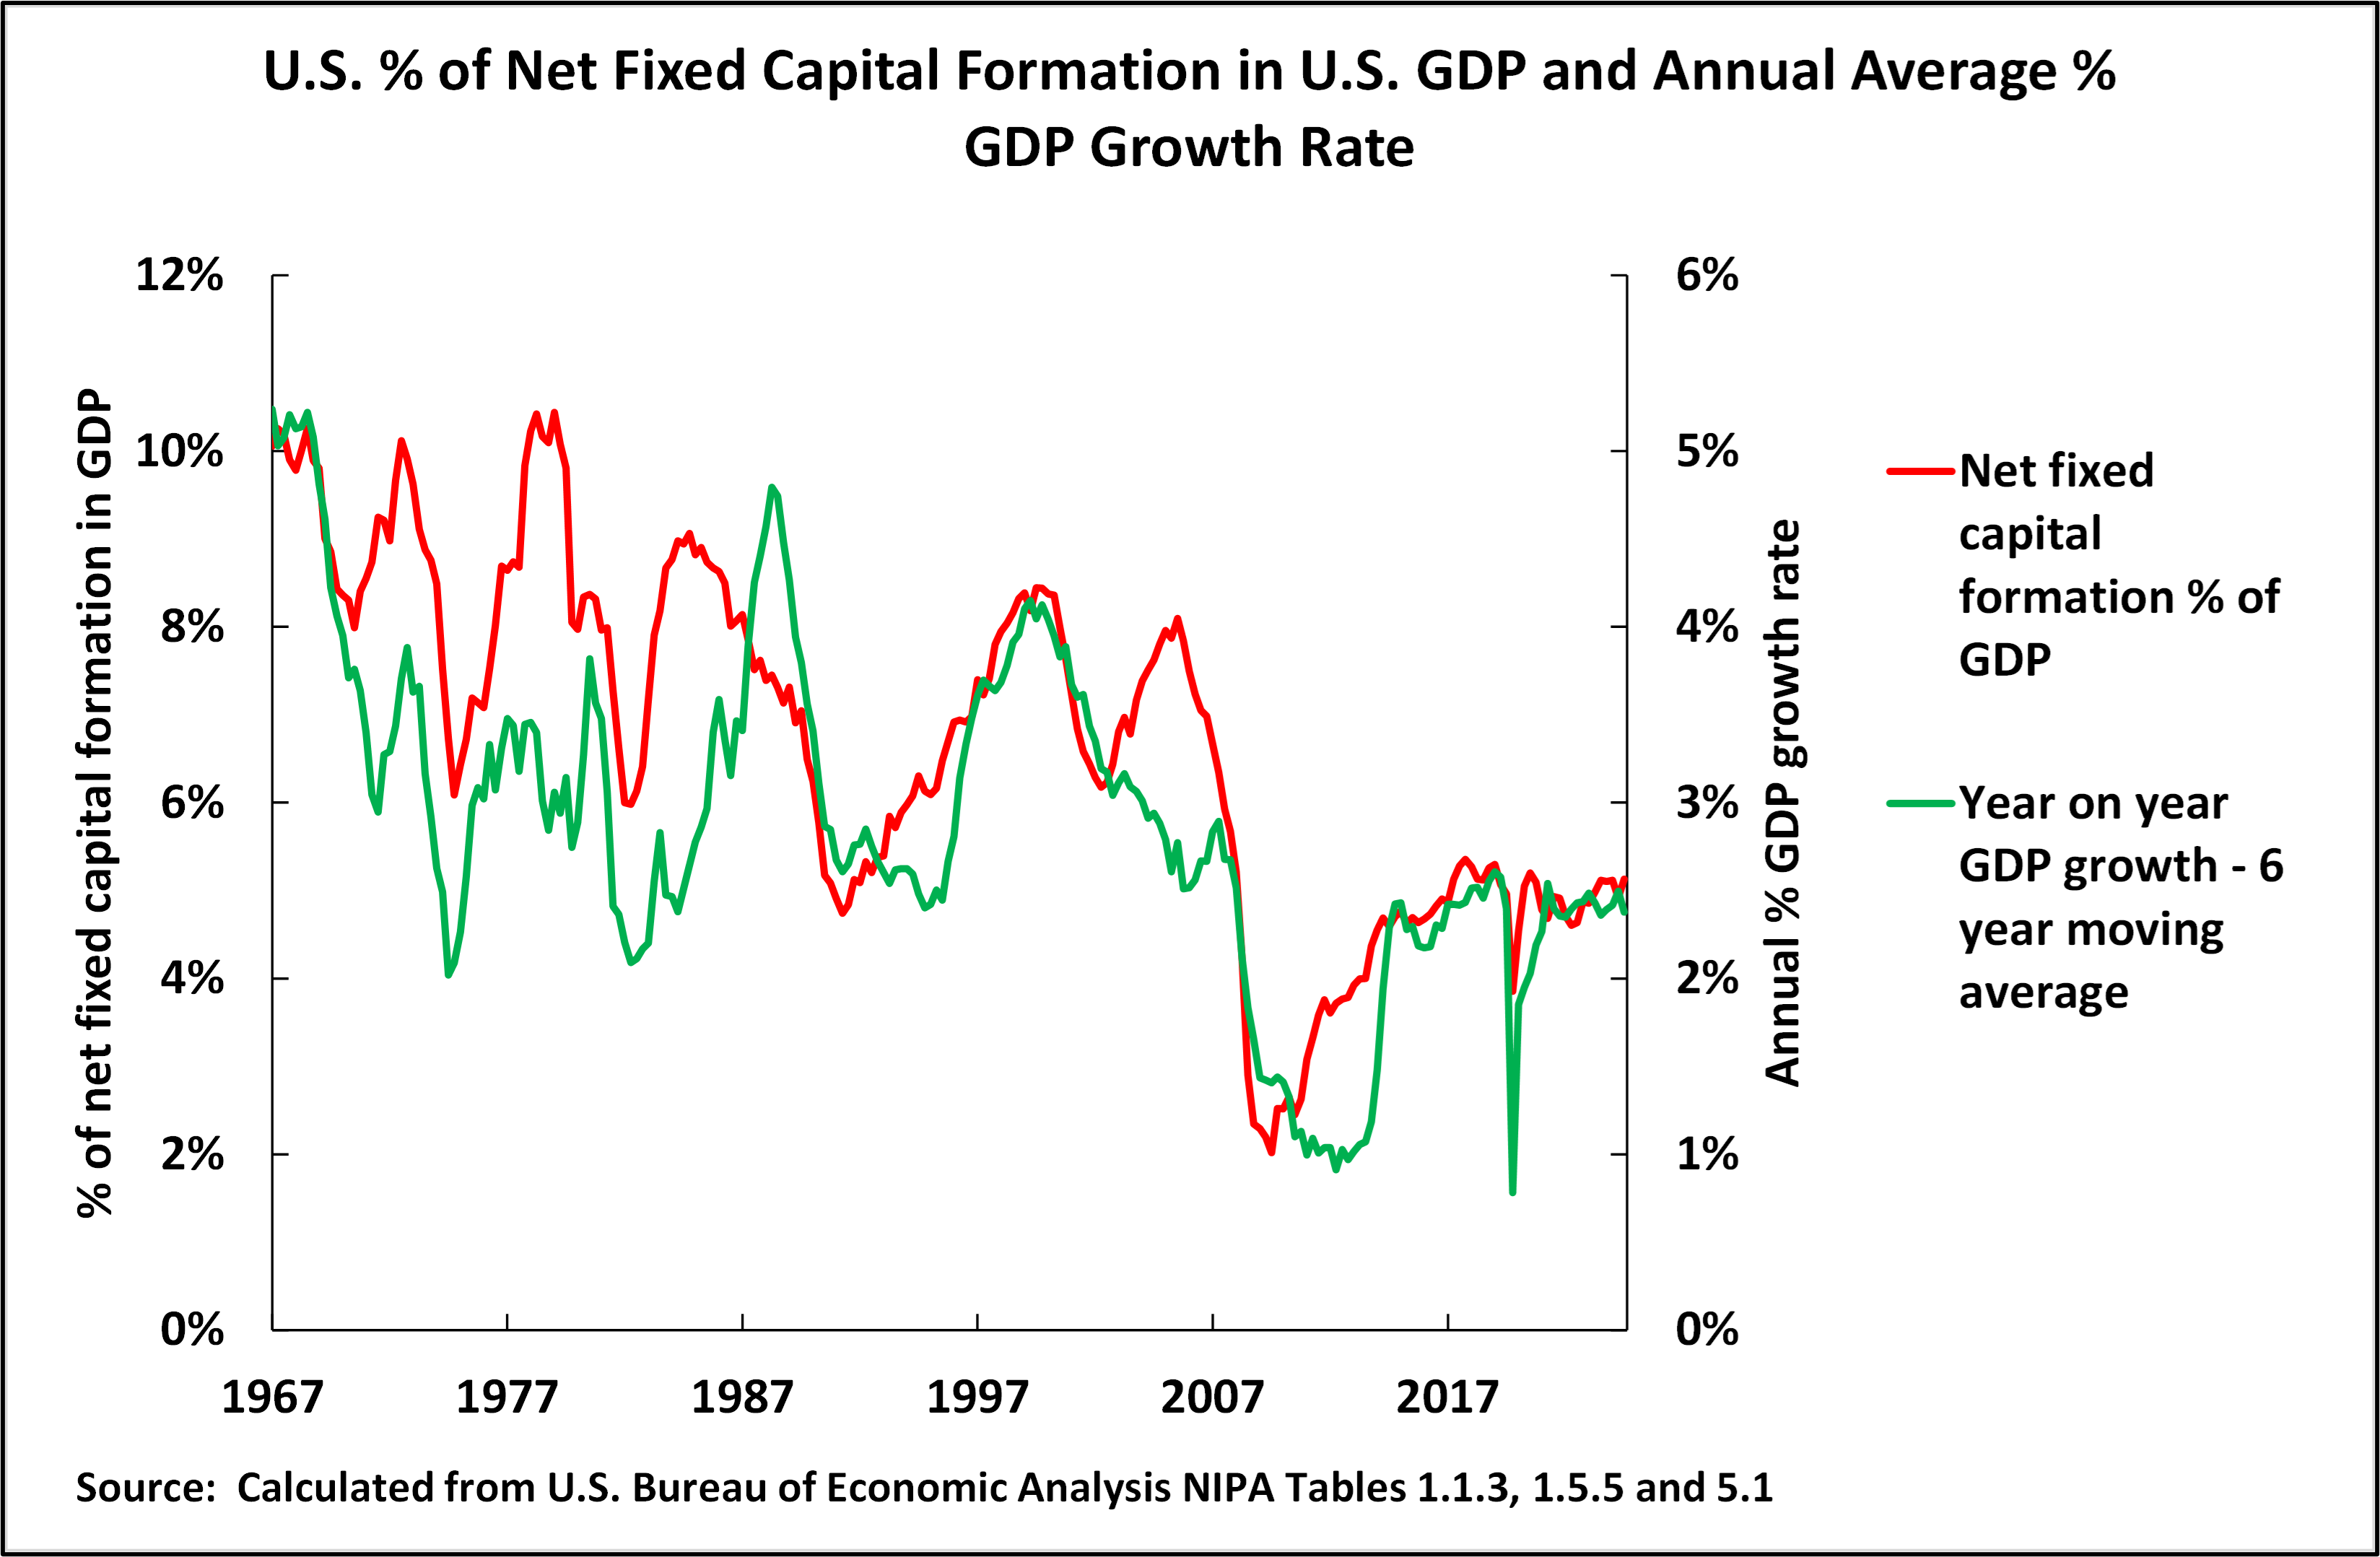
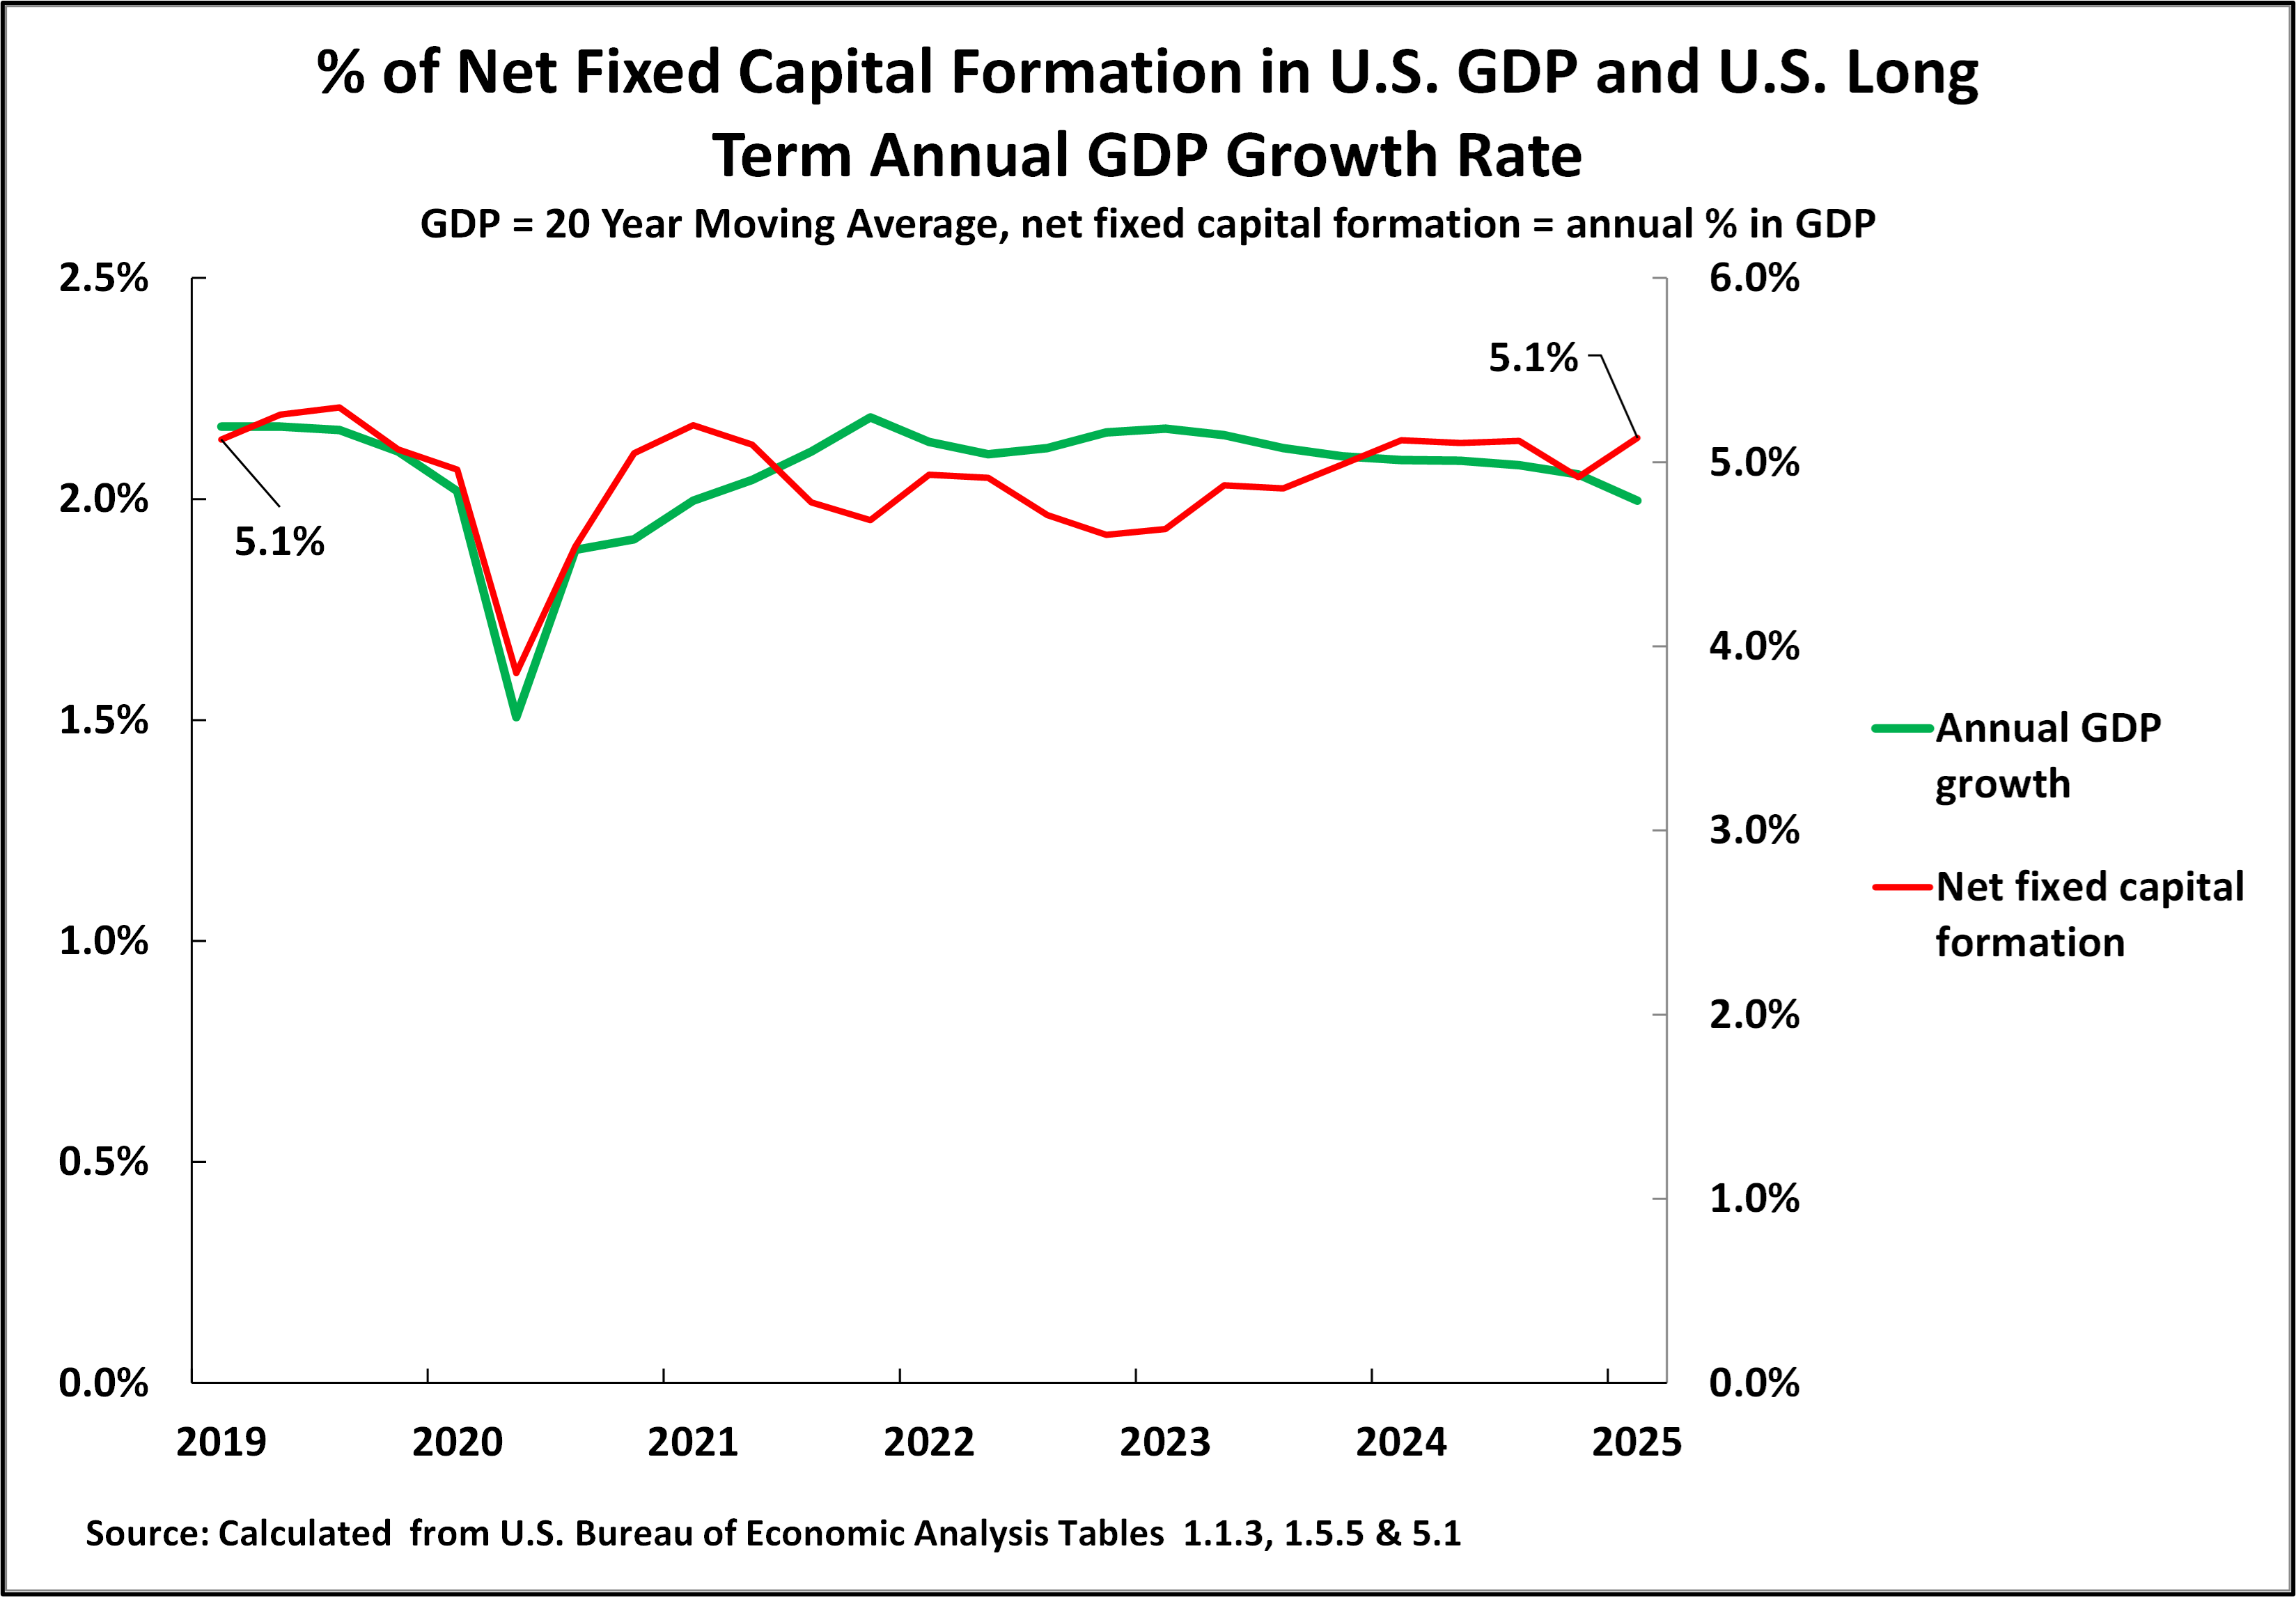
Turning to shorter term movements, as shown in Figure 11, the correlation between the annual percentage of net fixed investment in GDP and the annual average U.S. GDP % growth rate, taking a six-year average GDP growth rate, is 0.78 – six years is taken in this graph as the period for the moving average to correspond to the same length of time, 2019 to 2025, which has elapsed since the peak of the previous U.S. business cycle. As would be anticipated from previous factual data, if a longer period is taken, the correlation is even higher - the correlation for a 10-year period is 0.81 and for a 20-year period it is 0.82.
Figure 11
No current decline in the percentage of net fixed investment in U.S. GDP
Bearing in mind this relation, Figure 12 then shows that since the peak of the last U.S. business cycle in 2019 to the latest data for the first quarter of 2025 there has been no decline in the percentage of net fixed capital formation in U.S. GDP – it was 5.1% of U.S. GDP at both the beginning and the end of the period. Therefore, there has been no change in the factor that is most closely correlated with GDP growth in the United States. There is, therefore, no factual trend that would indicate that there should be a downturn in the present long-term average growth rate of U.S. GDP - which, as already seen, is slightly above two percent a year.
In summary, neither the situation of U.S. financial markets nor of U.S. macroeconomic data is there any indication of any process that would produce any downward fluctuation in the U.S. outside the range of normal business cycle changes. Nor is there any indication of a “boom” in the U.S. economy. That is, there is no evidence for either the “manic” nor the “depressive” analysis of the U.S. economy.
Therefore, there is no factual sign of any shift or crisis in the U.S. that would force a rapid outcome of the economic clash between the U.S. and China. Therefore, the outcome of the “protracted” struggle of the U.S. against China will be determined by the factors that determine the long-term growth of the two economies.
Figure 12
The growth pattern of large economies
Thus far, specifically, the growth pattern of the U.S. has been analysed. However, it should be clearly understood that this very high correlation of the percentage of net fixed capital formation in GDP and GDP growth in the U.S. is not exceptional, but is in line with all other major economies, including China.
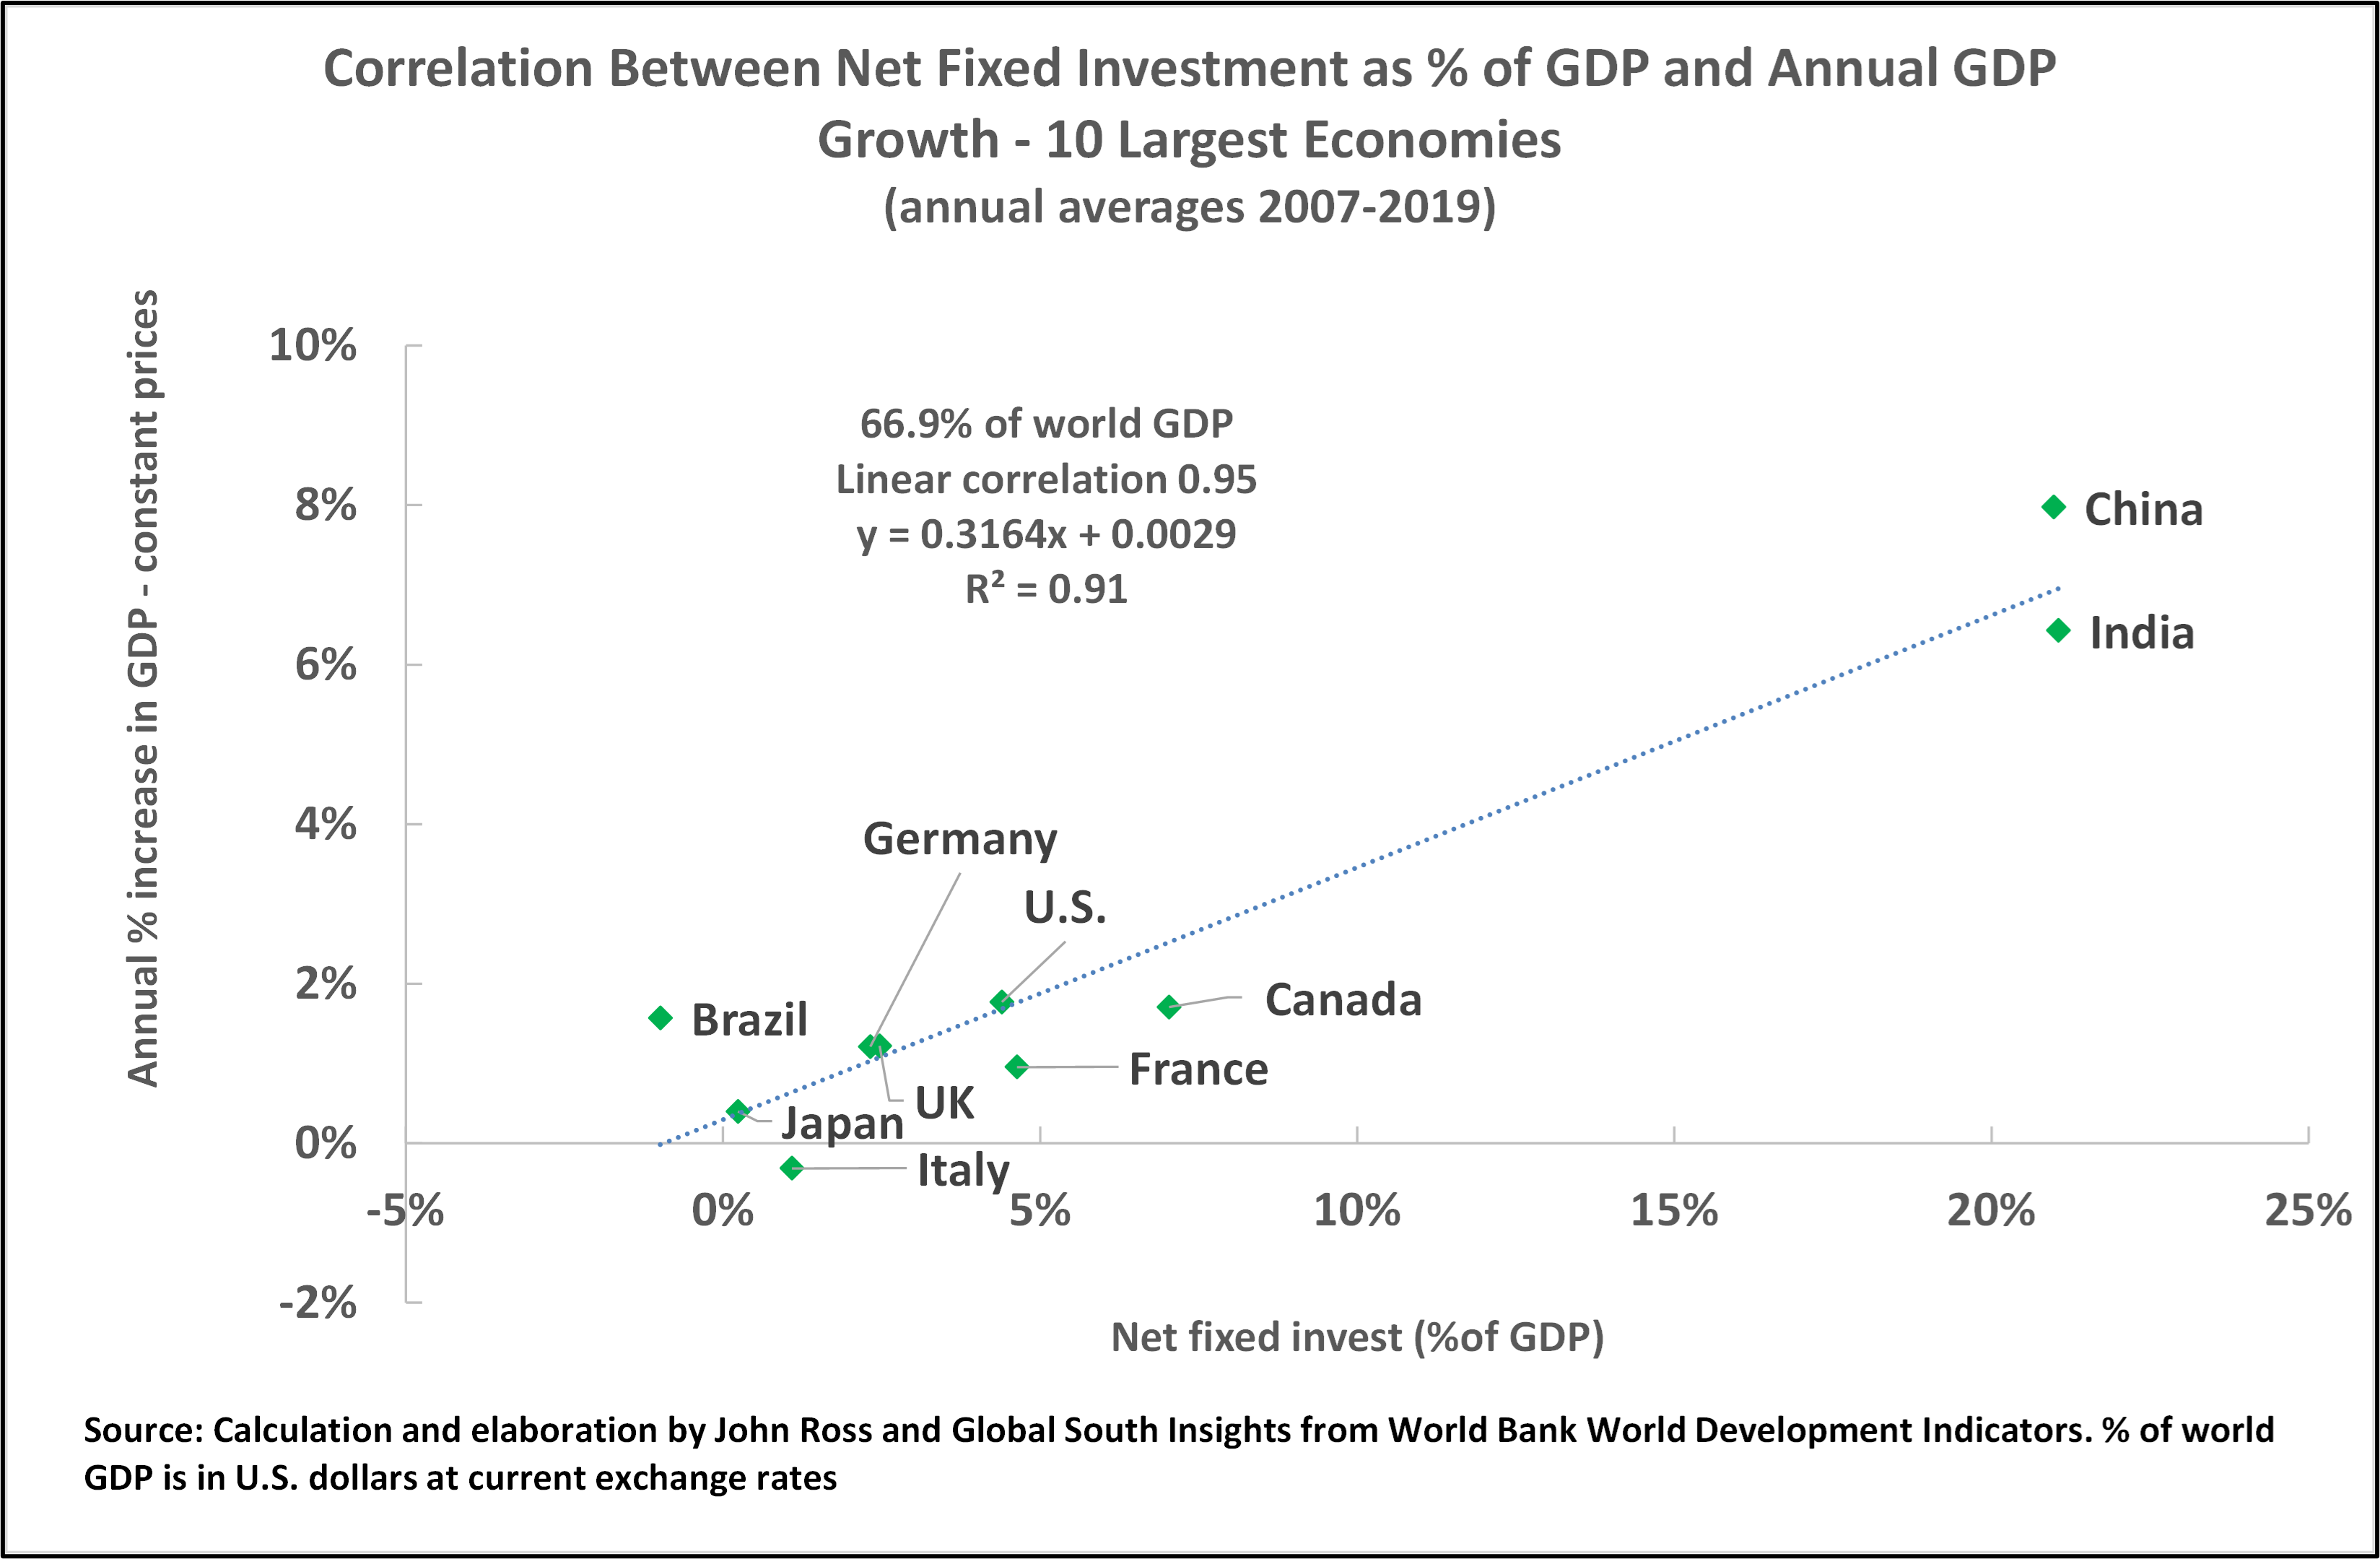
Therefore, Figure 13 shows the correlation between the percentage of net fixed capital formation in GDP and the annual average percentage GDP growth in the world’s 10 largest economies, which, of course, include both the U.S. and China. As can be seen, this correlation is ultra-high at 0.95.
Therefore, in terms of long-term growth, there is no possibility that such large economies have a high rate of GDP growth without a high percentage of net fixed investment in GDP. Any decrease in the percentage of net fixed investment in GDP will be accompanied by a decline in the rate of GDP growth, and any acceleration of GDP growth requires an increase in the percentage of net fixed capital formation in GDP.
Figure 13
China’s pattern of economic development
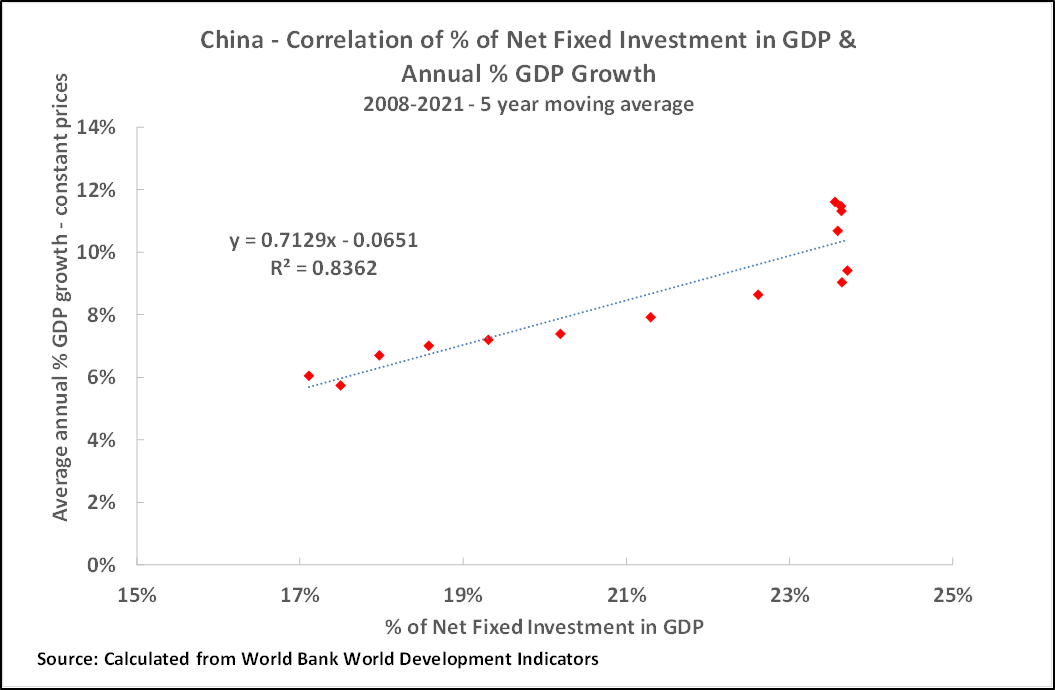
Turning to China’s development, this shows the same pattern as that of other large economies. Figure 14 shows that the correlation between the percentage of net fixed capital formation in China’s GDP and China’s GDP growth rate in the period from the international financial crisis up to the latest available data for net fixed capital formation is an extremely high 0.84.
That is, the long-term growth rates of both China and the U.S., as with all very large economies, are closely and positively correlated with the percentage of net fixed capital formation in GDP. It is unnecessary for the present purposes to determine the direction of causality in this – whether the percentage of net fixed capital formation in GDP determines the GDP growth rate, the GDP growth rate determines the percentage of net fixed capital formation in GDP, or some other factor(s) determine both. However, this means that China’s GDP growth rate cannot be accelerated without increasing the percentage of net fixed capital formation in GDP, and that any reduction in the percentage of net fixed capital formation in GDP will lower the economic growth rate.
Figure 14
China and the U.S.’s level of net fixed capital formation
The consequence that flows from these facts for competition between the U.S. and China is clear from Figure 13. The extremely high correlation between the percentage of net fixed capital formation in GDP and the GDP growth rate in both economies, in common with all very large economies, means that as China has a much higher level of net fixed capital formation in GDP than the U.S., China’s economy grows more rapidly than the U.S. That is, in the competition between China and the U.S., China maintains a much higher economic growth rate than the U.S..
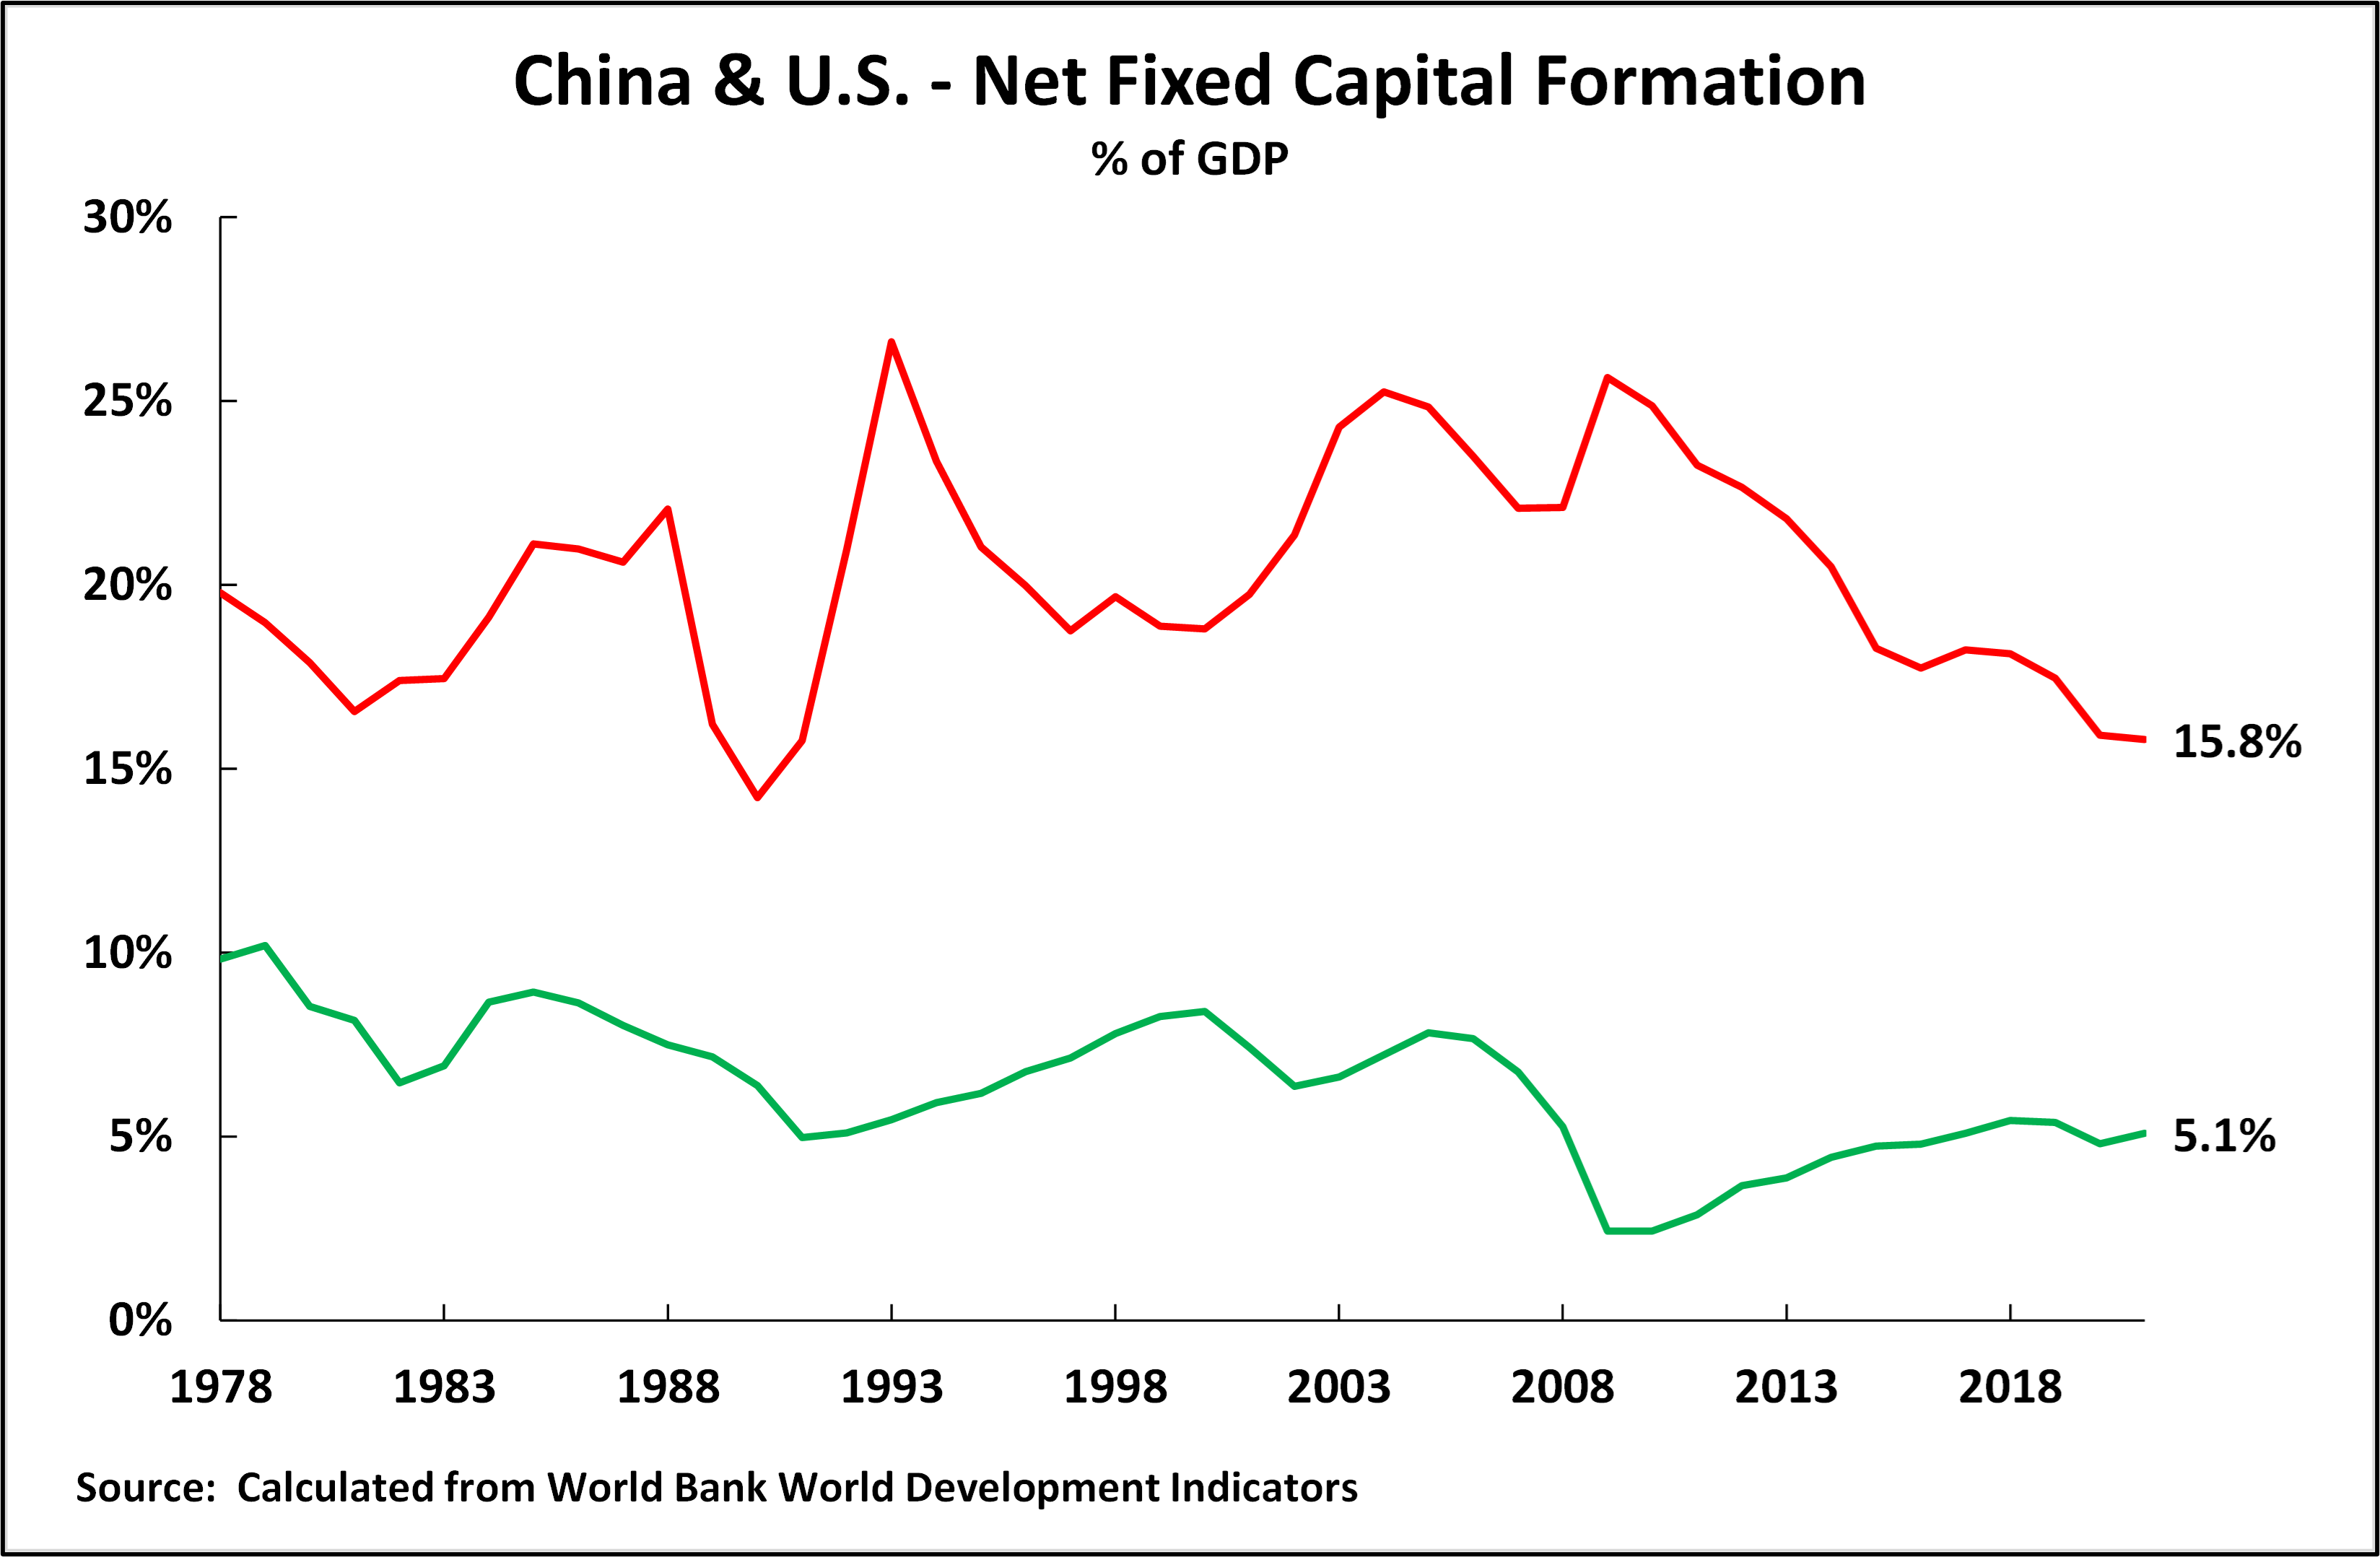
Figure 13 shows that taking the last business cycle as a whole, China’s percentage of net fixed capital formation in GDP was 21.0%, and that in the U.S. was 4.4%. Recently, as Figure 15 shows, the percentage of net fixed capital formation in China’s GDP declined, accompanied by a fall in China’s GDP growth rate. Nevertheless, in the most recent data, China’s percentage of net fixed capital formation in GDP, at 15.8%, is more than three times as high as 5.1% of the U.S.. As long as the lead of China over the U.S. continues, the factual data confirm that the long-term growth of China’s economy will continue to be far higher than that of the U.S.. That is, in terms of economic growth rates, the outcome of the “protracted war” between the U.S. and China will be determined by whether China maintains a higher rate of net fixed capital formation in GDP than the U.S..
Figure 15
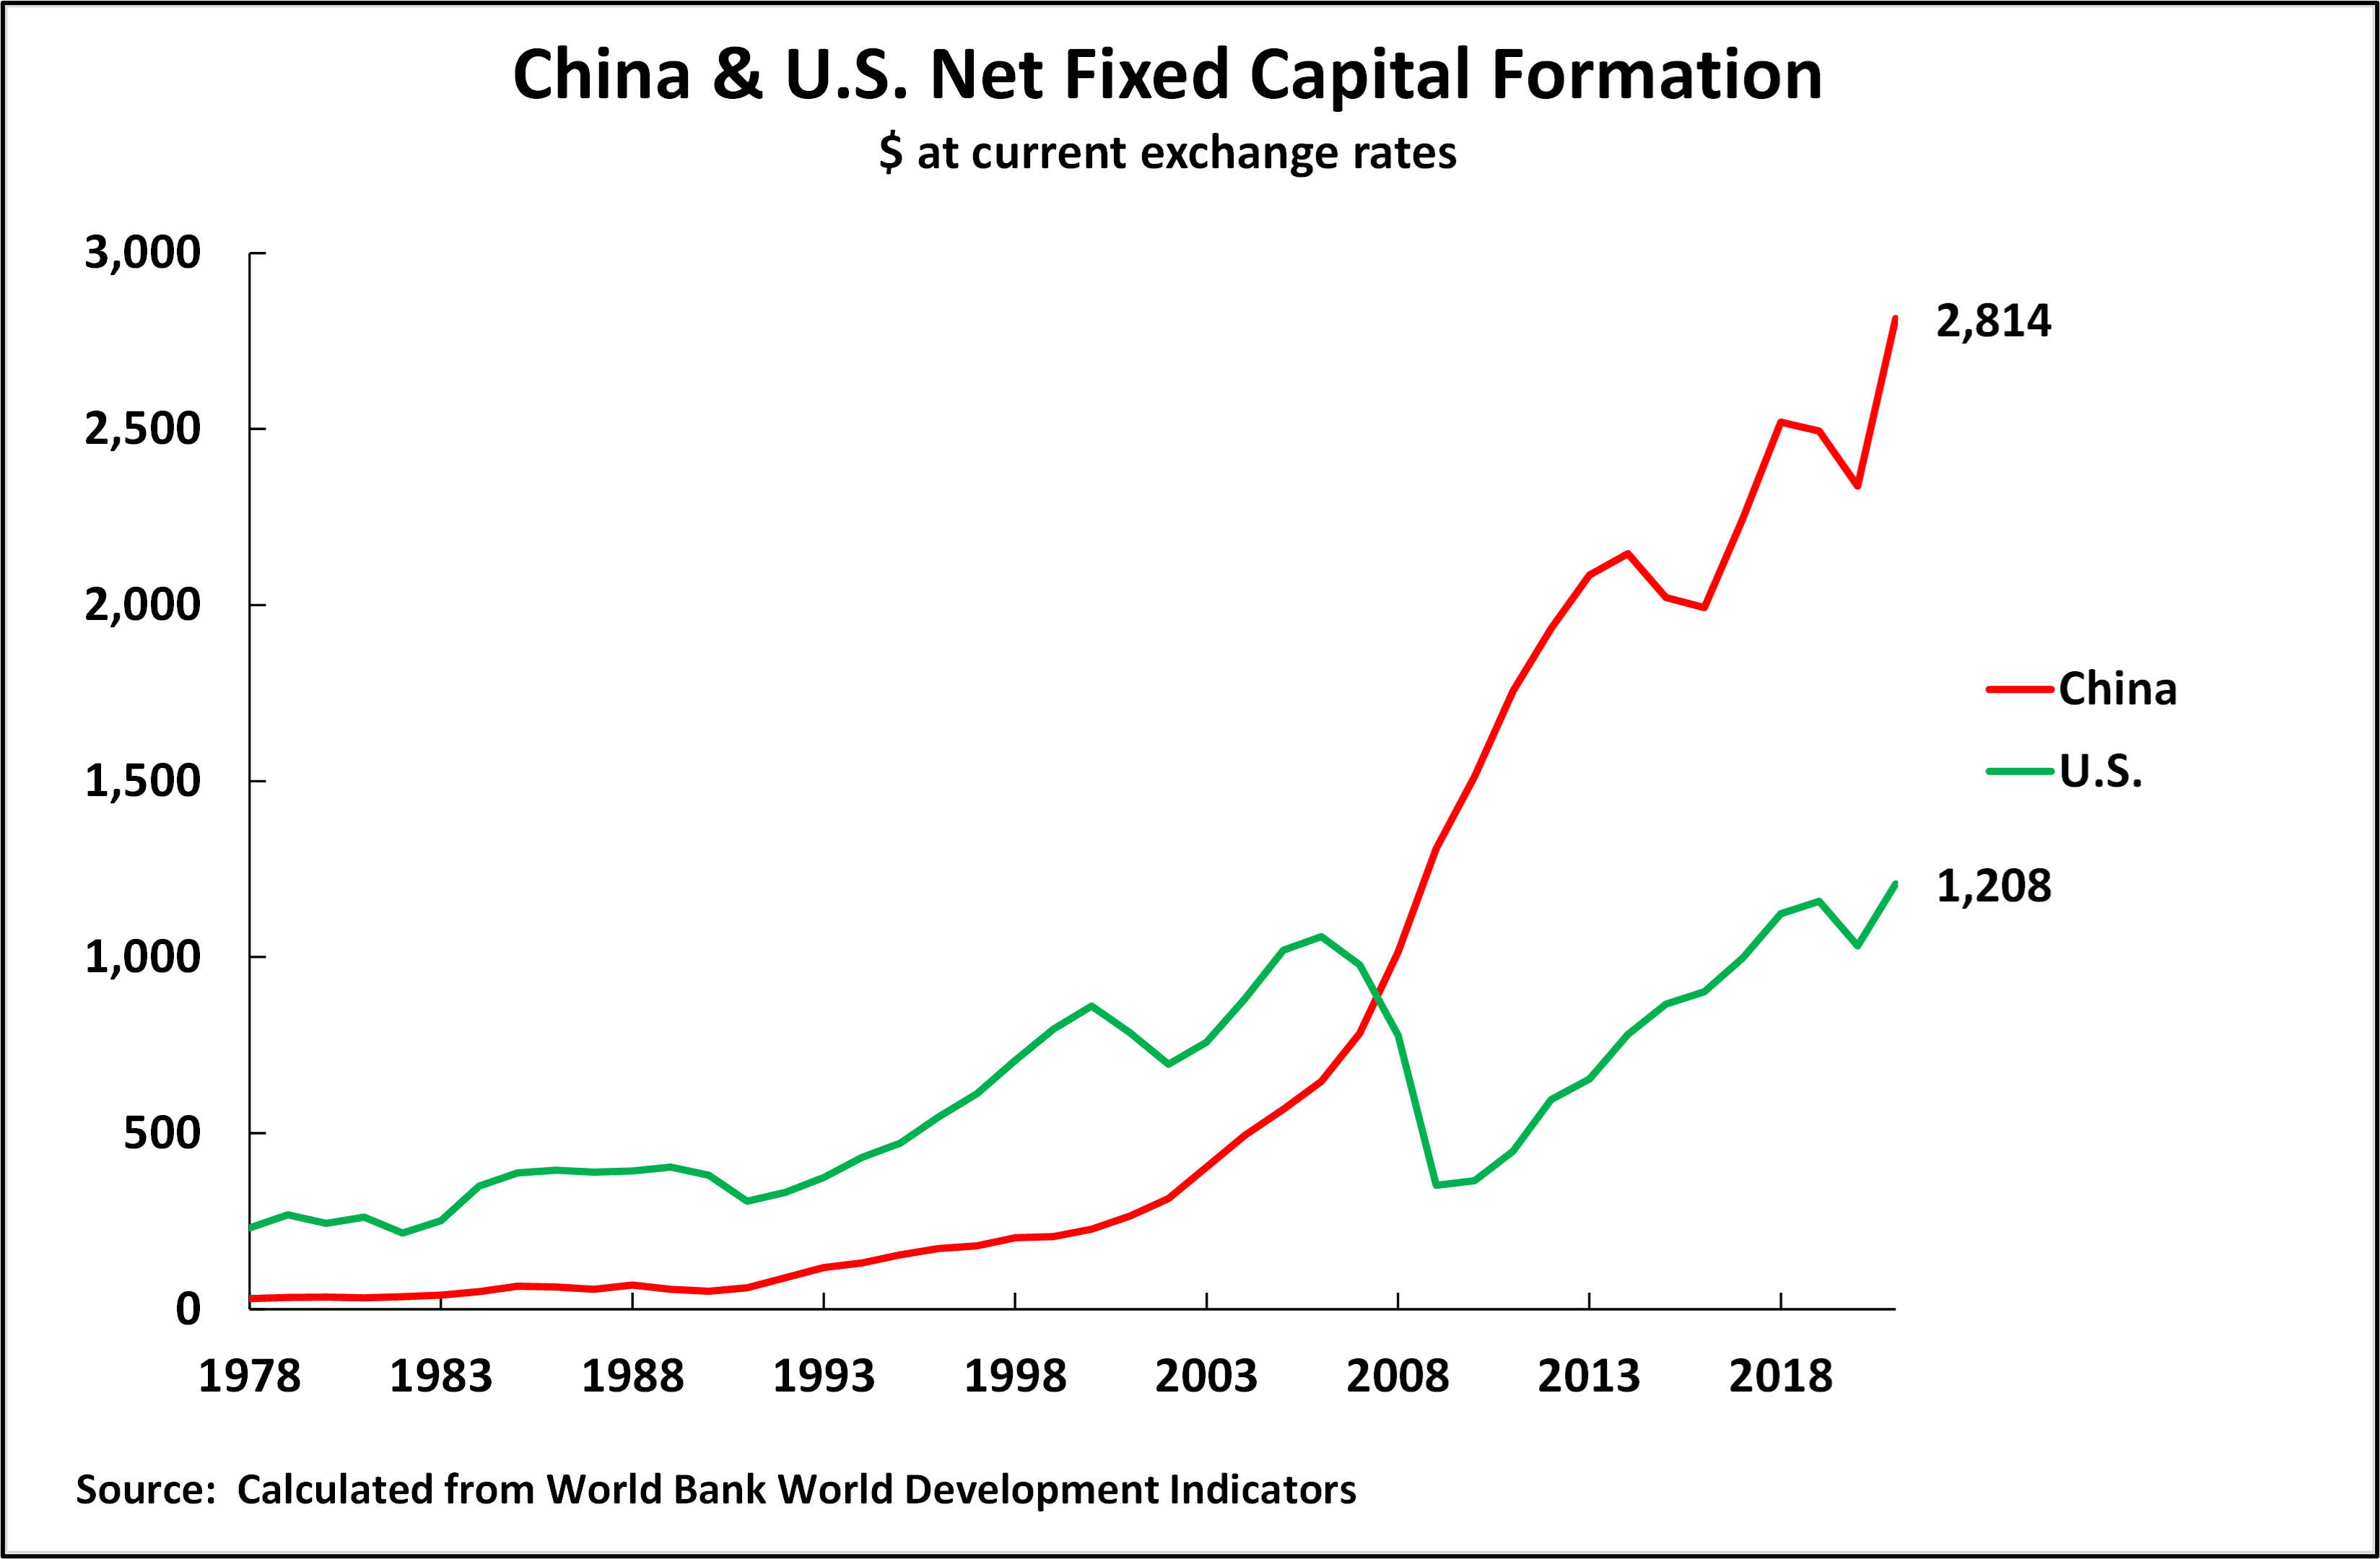
The absolute dollar levels of net fixed capital formation in the U.S. and China
Turning these percentages into absolute dollar figures, the above proportions of GDP mean that on the latest available internationally comparable World Bank data China’s annual net fixed capital formation is $2.8 trillion compared to $1.2 trillion. In absolute terms, China’s annual net fixed capital formation is therefore more than twice that of the U.S..
Figure 16
How the U.S. aims to defeat China
Given the factual relations shown above there are therefore in principle two ways that the U.S. could aim to defeat China in a “protracted war” determined by the long term growth rates of the two economies.
The first is for the U.S. to increase the percentage of net fixed investment in its GDP and, therefore, speed up the U.S. economy. However, for the reasons analysed in 特朗普选择先摧毁美国人民生活再“击败”中国,但结局很可能是…, to achieve this Trump, or any future U.S. president would have to impose a huge political defeat on the U.S. population, significantly cutting the percentage of household consumption in GDP, in order to achieve this. To date, no such change has occurred in the U.S..
The second means by which the U.S. could achieve victory in its “protracted” struggle with China would be to persuade China to reduce its proportion of net fixed capital formation to the level of the U.S. (or other Western economies). As was analysed in detail in 从210个经济体大数据中,我们发现了误解促消费对经济的危害 the U.S. would, of course, not argue for this in a direct way. It utilizes the fact that consumption and investment constitute 100% of the domestic economy. Therefore, if China can be persuaded to increase its level of consumption in GDP to that of the U.S./a Western economy, then China’s percentage of investment in GDP would necessarily fall to that of the U.S./a Western economy, and China’s growth rate would also necessarily fall to that of the growth rate of the U.S. economy - that is, around, or only slightly above, two percent year. If the U.S. and China’s economies grew at the same rate, then the U.S. would permanently retain its economic lead over China and win the “protracted” struggle between the two. That is, on the economic terrain, the outcome of the protracted struggle will be determined by whether the U.S. can persuade China to increase its level of consumption in GDP to that of the U.S./ Western economy.
This would also have major social consequences in China because the percentage of consumption in GDP and the growth rate of consumption are inversely correlated; that is, if China raised the percentage of consumption in GDP, its growth rate of consumption, and therefore the growth rate of living standards, would slow. A detailed analysis of this data was given in 从210个经济体大数据中,我们发现了误解促消费对经济的危害.
Conclusion
To summarise the key facts.
The points above have examined in detail both trends in U.S. financial markets in order to obtain the most up-to-date information, and in the U.S. macroeconomy - in order to obtain the most comprehensive available data. All the different forms of factual data are consistent and lead to the same conclusion: that the U.S. is experiencing neither great booms nor great crises, but normal business cycle fluctuations around a rate of growth that is slightly above two percent per year. Therefore, this is the central perspective. Therefore, there is no indication of either a great boom in the U.S. economy or a deep crisis, which would lead to a rapid resolution of the competition between the U.S. and China. Instead, not only for strategic but also for economic reasons, a “protracted” struggle is posed. The outcome of this will, therefore, be determined at the economic level by the factors that determine the long-term growth of the Chinese and U.S. economies. The data show that the most powerful of these long-term factors is the percentage of net fixed capital formation in the GDP.
In summary, the outcome of the protracted economic struggle between the U.S. and China will be decided by whether China can maintain its higher level of net fixed capital formation in GDP than the U.S. or whether the U.S. can persuade China to raise its level of consumption in GDP to that of the U.S./a Western economy - and therefore for China’s level of investment in GDP to fall to that of the U.S./a Western economy. If this occurs, China’s rate of GDP growth and its growth rate of consumption will fall to that of the U.S./a Western economy and, therefore, the U.S. will retain its lead over China and secure victory in its competitive struggle with China.
Appendix - the interrelation of innovation and investment
As an appendix, it is useful to analyse one further issue. This is the interrelation between innovation and investment, as it is crucial to the development of new productive forces that are key to China’s economic development.
This issue is a confused idea, which sometimes appears in some sections of the media, that innovation can be a substitute for investment, rather than investment being the complement of innovation and that innovation must be embodied in investment. As the data confirm, as long as an innovation remains only an idea, it does not greatly affect the economy; it is only when it is embodied in actual investment that it becomes powerful. Thus, to take the example of a truly revolutionary innovation, the Internet, to profoundly affect the economy, had to be embodied in massive investment in computers, software, telecommunications, etc..
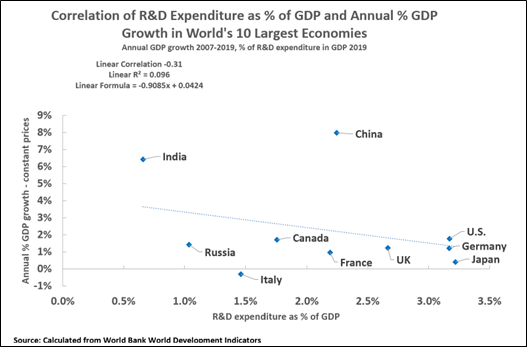
To illustrate this point, Figure 17 shows the correlation between the percentage of R&D, which is the key to innovation, in GDP and annual GDP growth for the world’s 10 largest economies. As can be seen, there is only an extremely low/no significant correlation between the percentage of the economy spent on R&D and GDP growth; the correlation is -0.31 and the R squared is 0.01. In other words, there is no evidence of a direct influence of R&D on GDP growth. This correlation is in direct contrast to the data above, which showed an extremely close relationship (0.95) between the percentage of net fixed capital formation in GDP and GDP growth in the same ten largest economies.
Figure 17
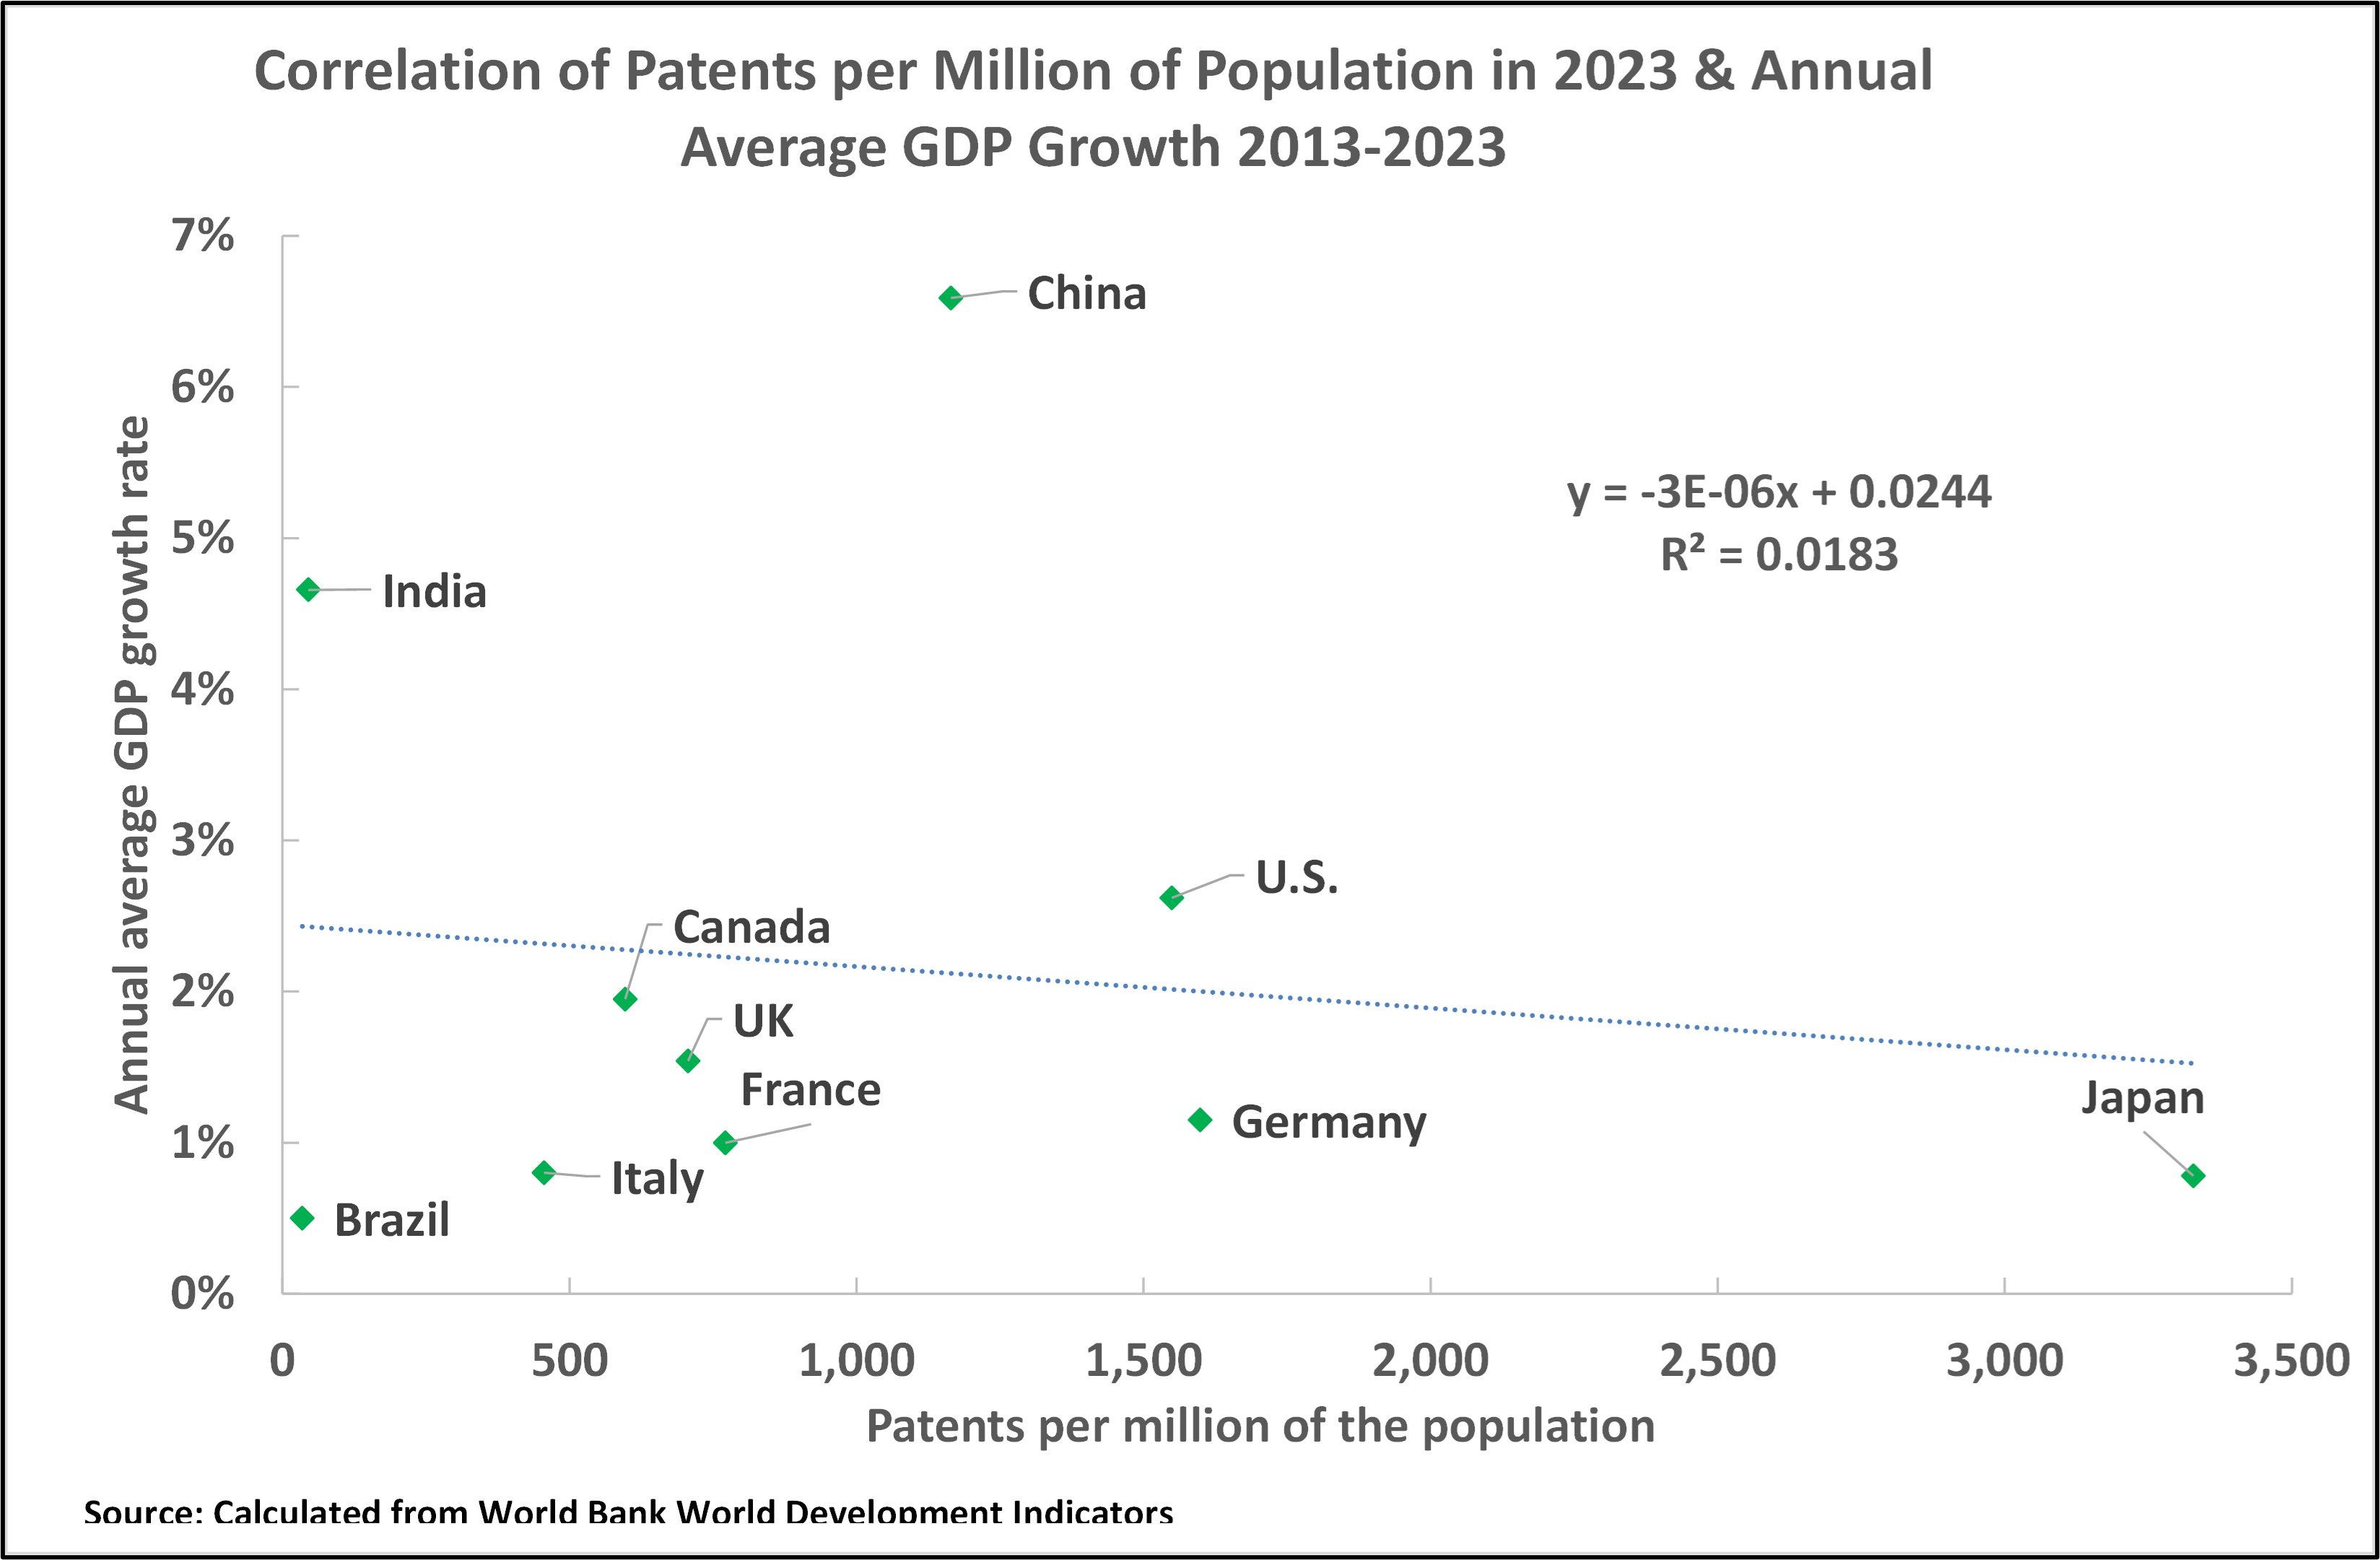
To take another measure of innovation, Figure 18 shows the correlation between the number of patents per million of the population and annual average GDP growth for the world’s ten largest economies. The correlation is insignificant - the correlation is -0.14, and the R-squared is .02.
Regarding patents, China has a medium number of patents per million of the population but a fast growth rate, Japan has a very high number of patents per million of the population and a very low growth rate, and India has a very low number of patents per million of the population and the second highest GDP growth rate after China. In other words, as confirmed by the data, there is no consistent relationship between the number of patents and the speed of GDP growth.
In short, the standard measures of innovation, the number of patents, and the percentage of R&D in GDP show no significant correlation with GDP growth.
Figure 18
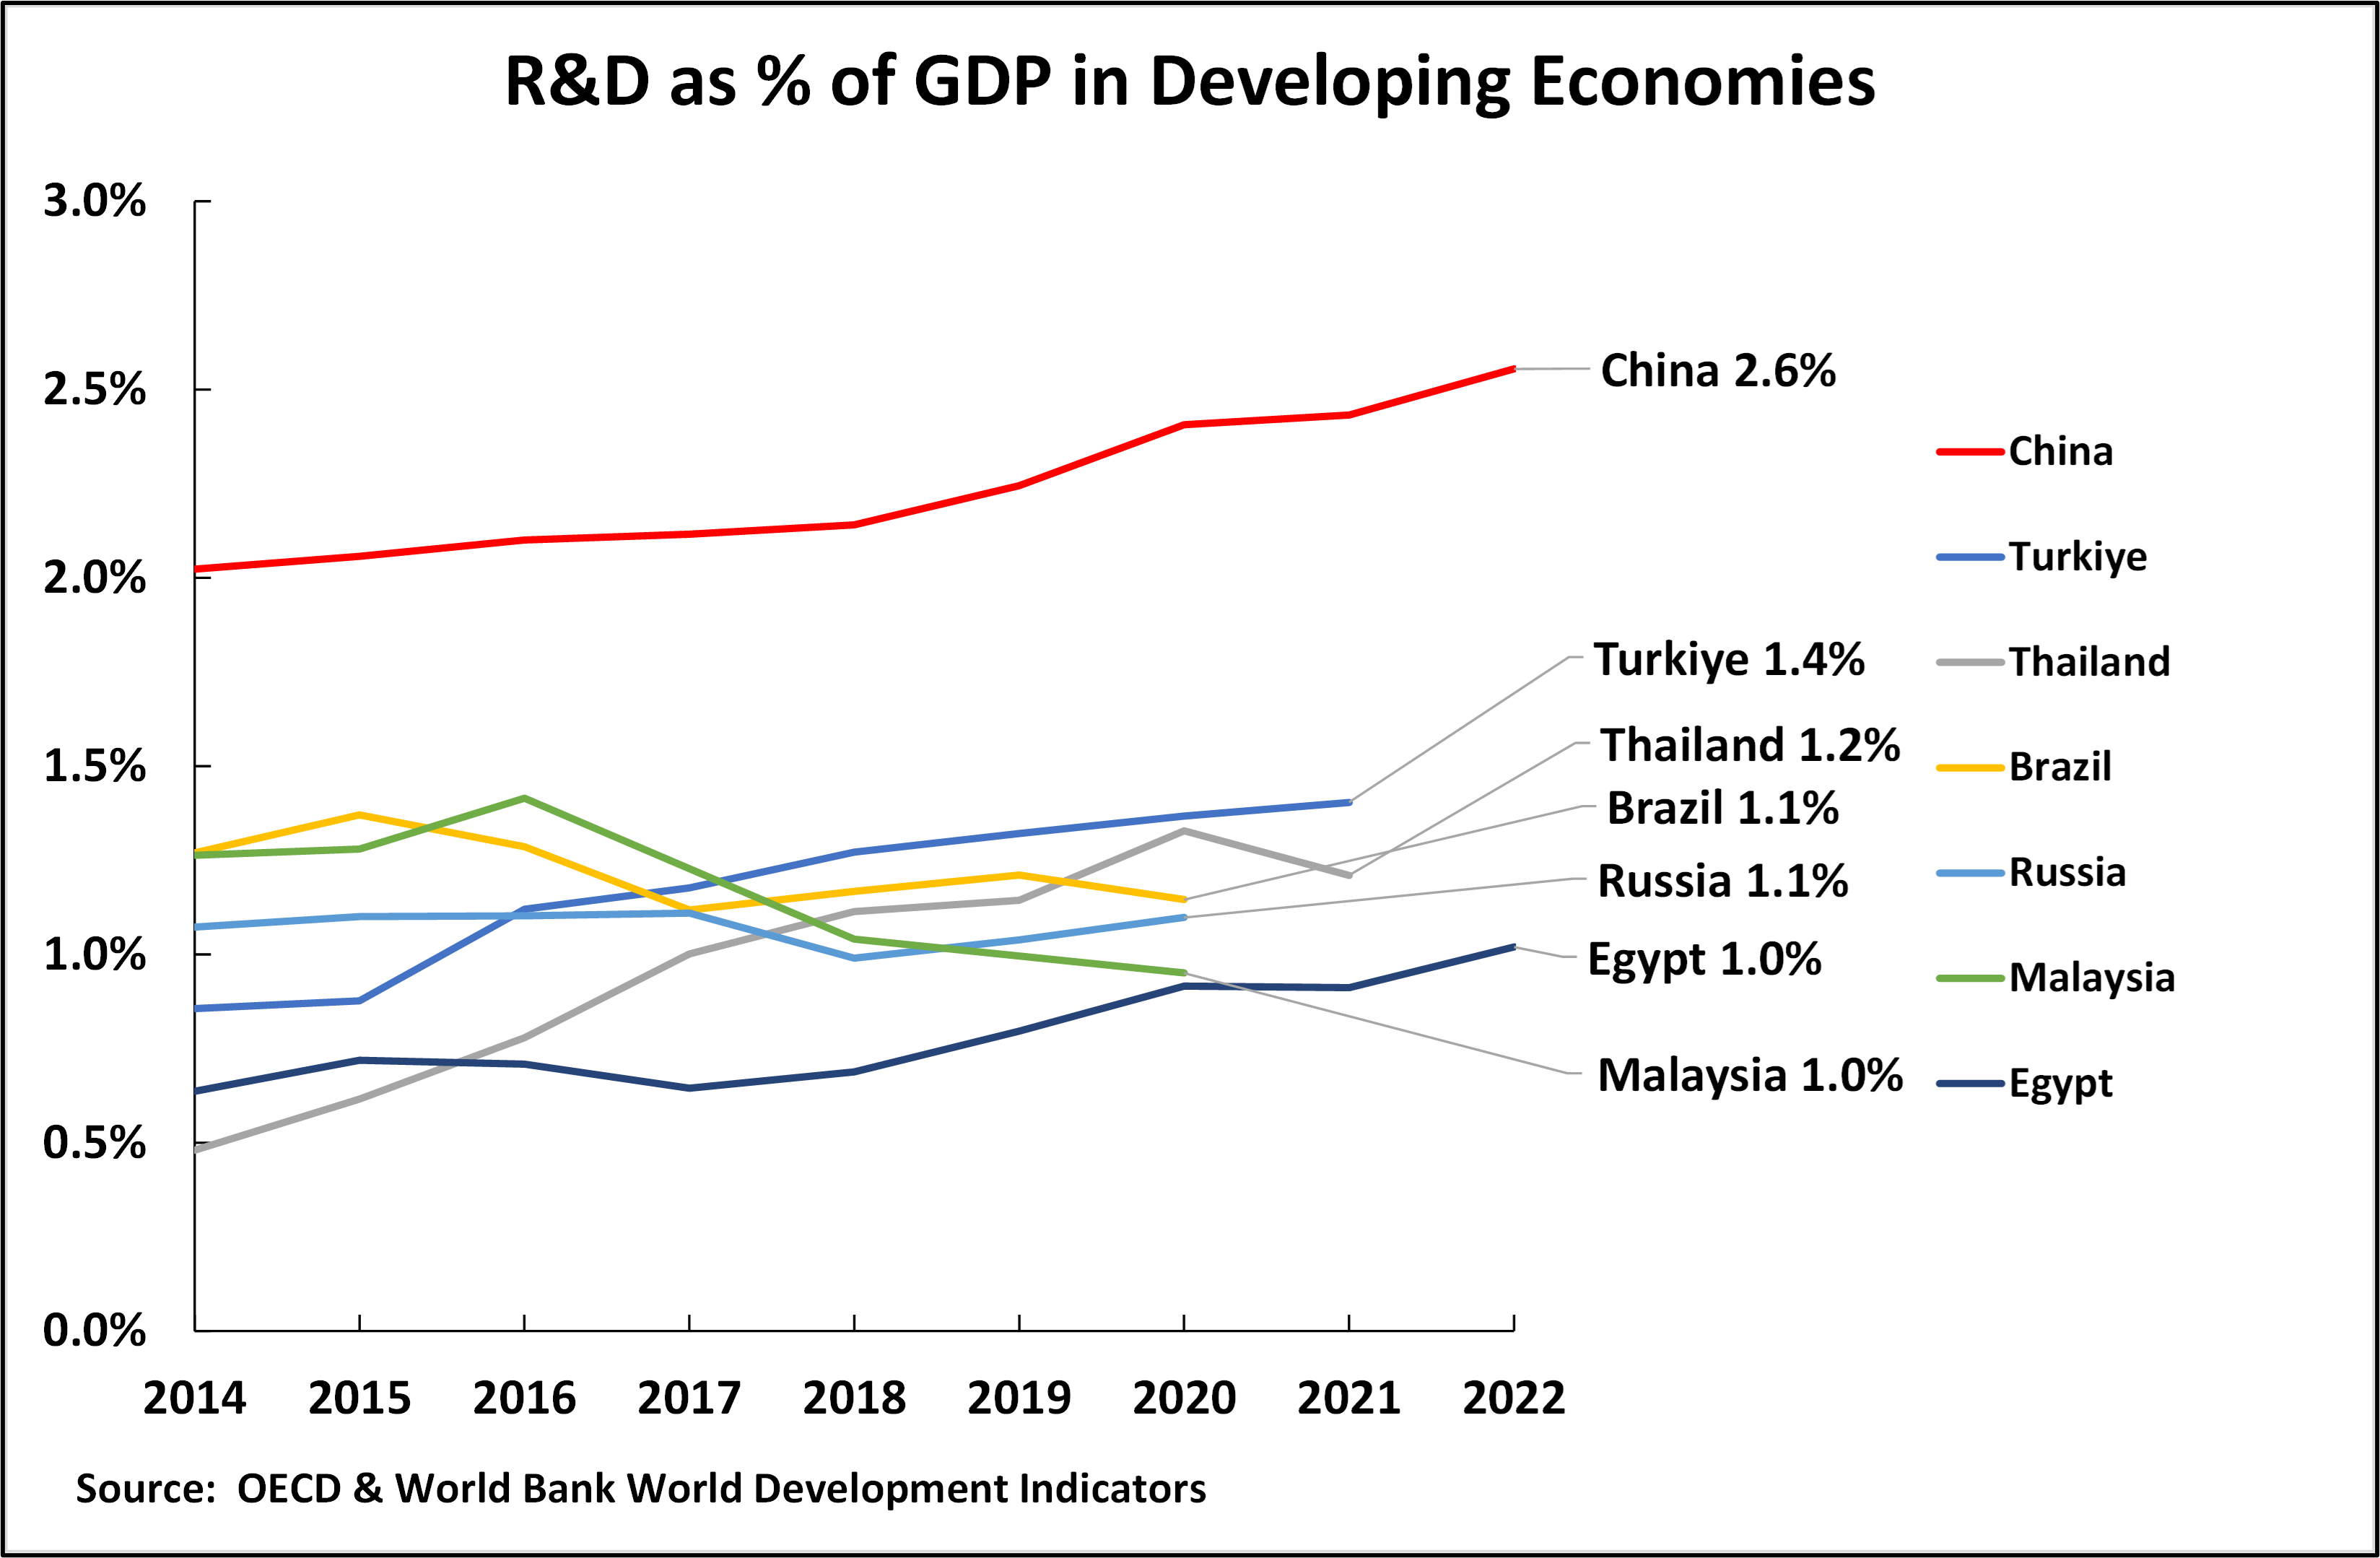
Does this imply that innovation is not important for economic growth? Obviously not. China’s technological upgrading and its development of new productive forces reflect its overwhelming lead in its percentage of R&D in GDP among developing countries (see Figure 19). According to the latest OECD data, China’s percentage of GDP spent on R&D (2.6%) is almost double that of the second most developed economy, Turkiye at 1.4%, and is more than twice that of fellow BRICS economies Brazil and Russia at 1.1% each. That is, as a percentage of the economy, China has a huge lead in R&D spending compared with any other developing country.
Figure 19
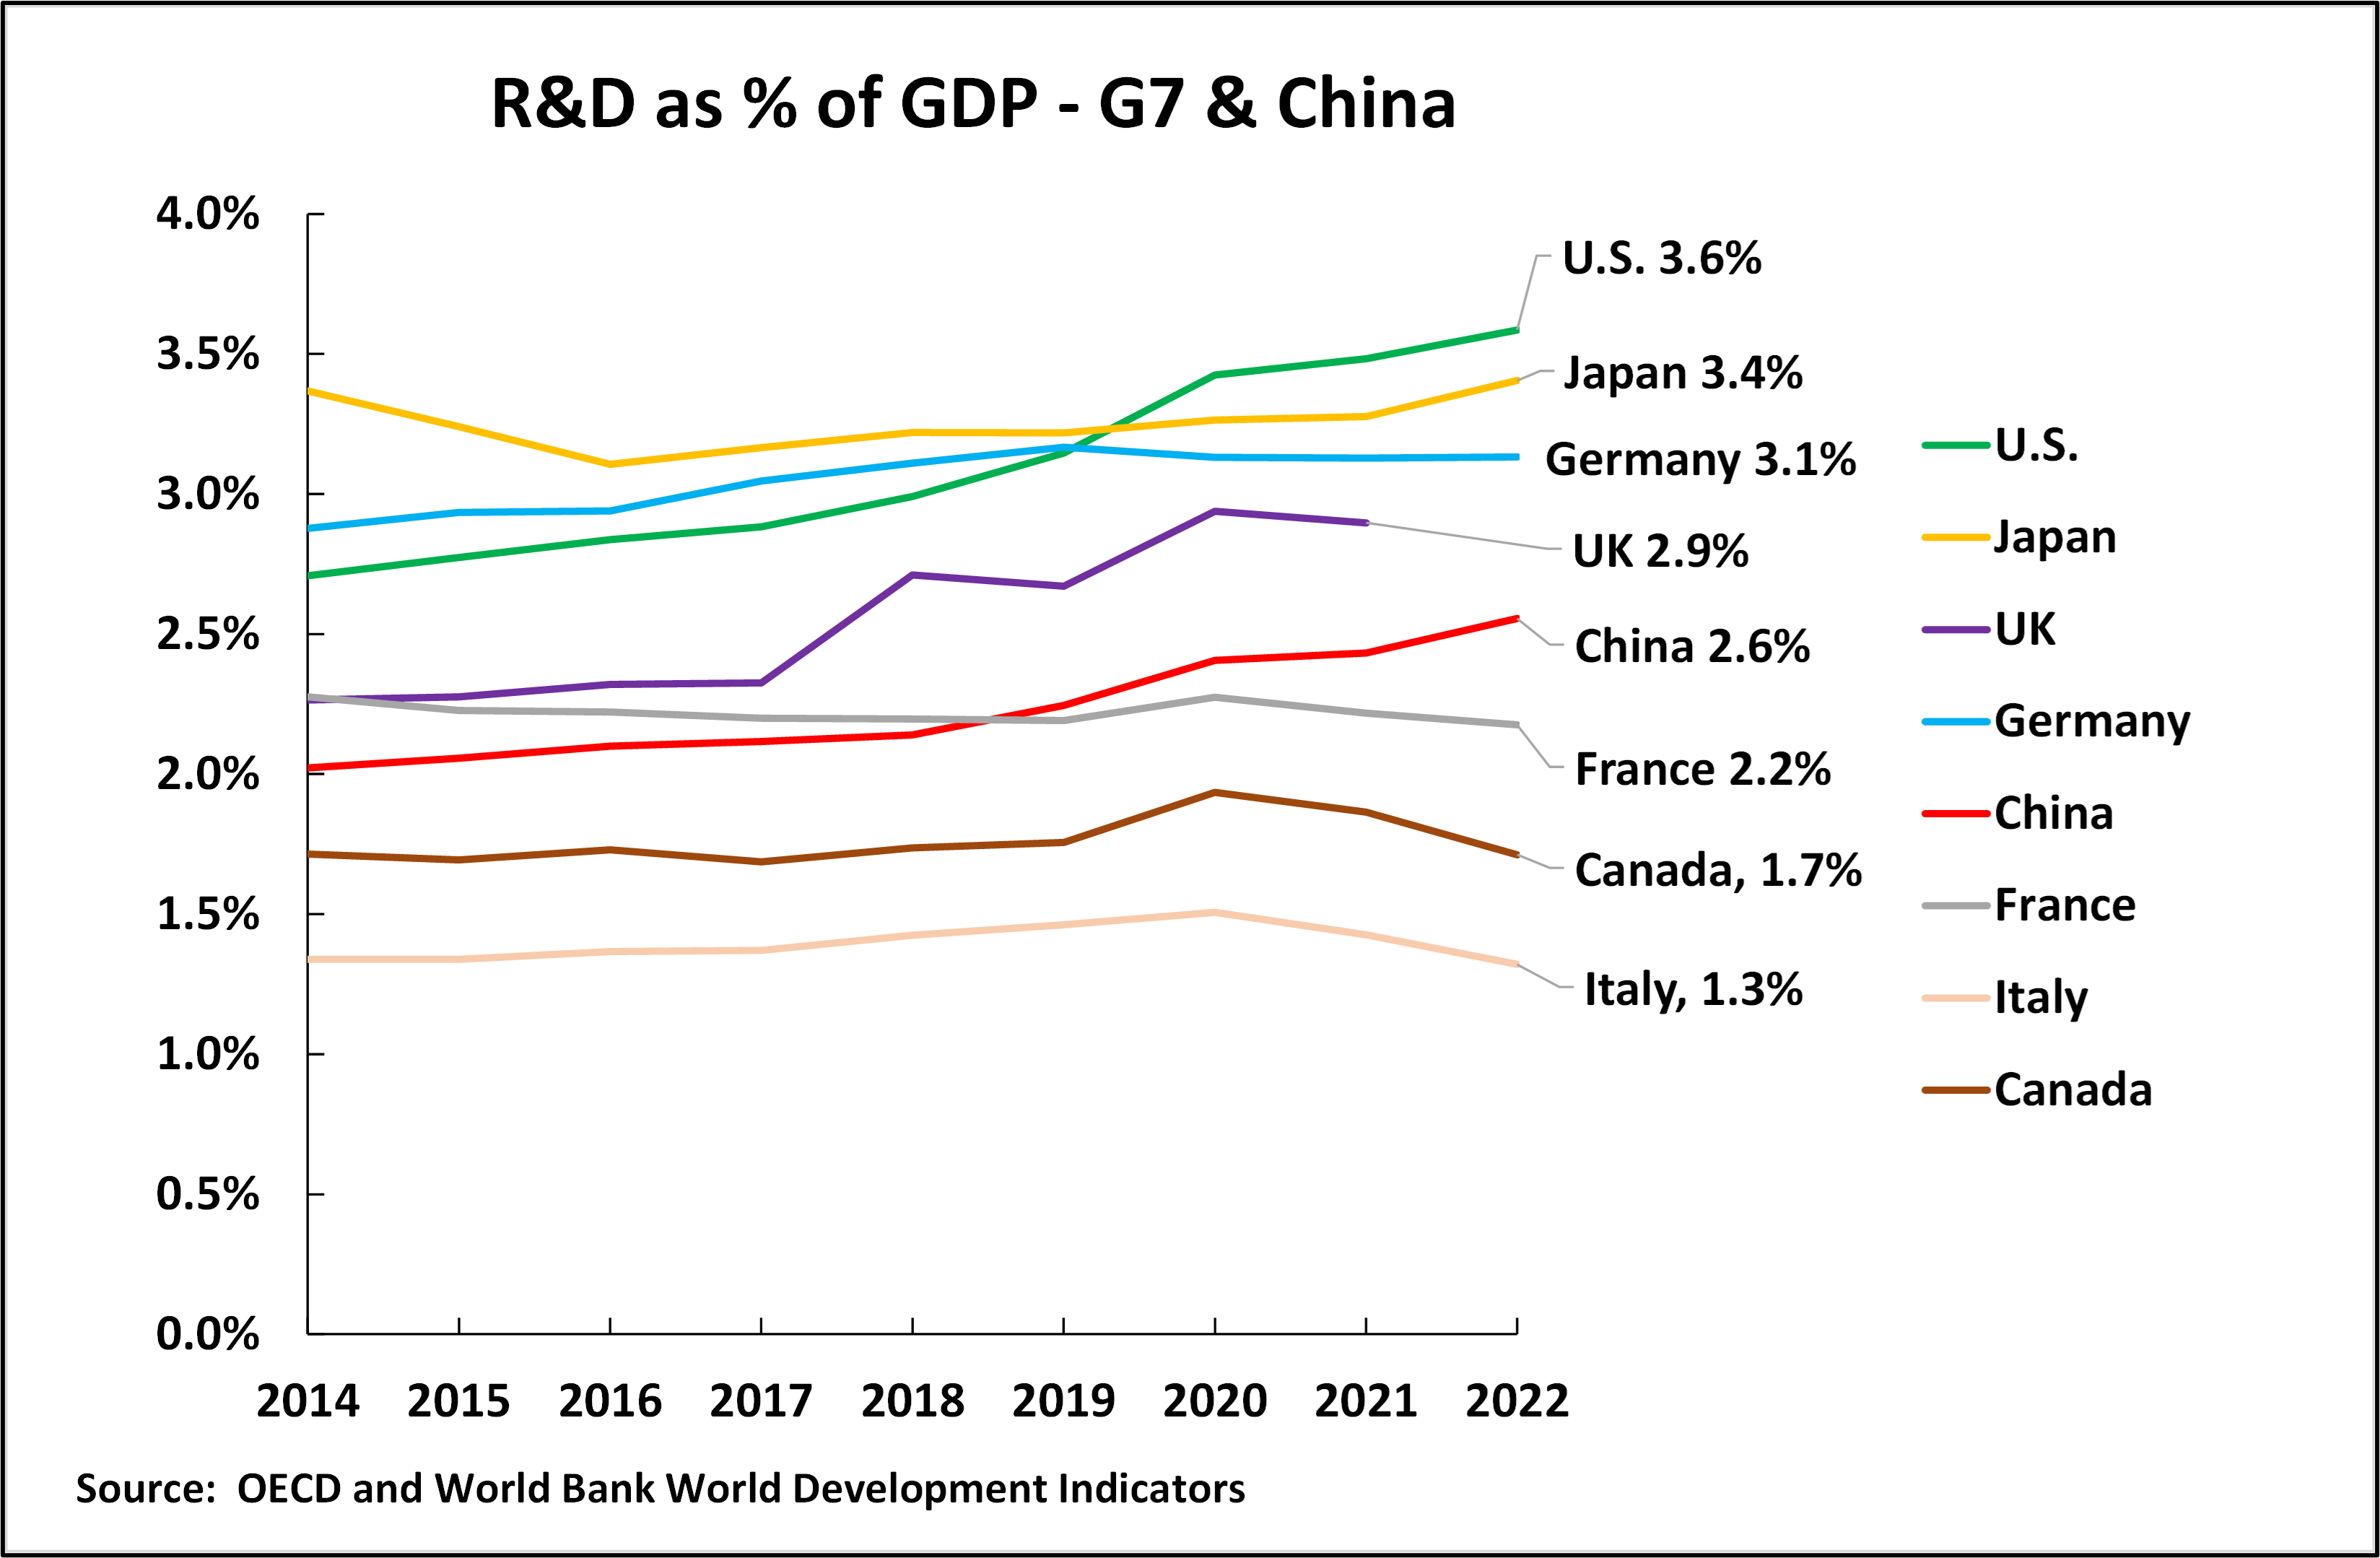
However, a comparison of China to advanced G7 economies is shown in Figure 20. As can be seen, China’s percentage of R&D expenditure in GDP has surpassed three G7 economies: France, Canada, and Italy. However, China’s spending on R&D as a percentage of GDP still lags behind four of the G7 economies: the U.S., Japan, the UK, and Germany. This measure of R&D spending is approximately in line with the patent data shown in Figure 18, where China still lags the U.S., Japan, and Germany in terms of the number of patents per million population. That is, by standard measurements of innovation, while China has a large lead over other developing countries and over some of the G7 countries, it still lags the most advanced G7 economies.
Figure 20
It will take a significant period of time for China to catch up with all the leading G7 economies in the proportion of the economy spent on R&D, as developing this does not depend only on financial resources but on the existence of very large numbers of highly educated, trained, and skilled researchers and scientists who cannot be produced extremely rapidly. It takes 20 years from someone entering school to emerging with a PhD in engineering or mathematics, which are the types of key qualifications required for advanced R&D. Therefore, closing this gap will take years.
To summarize, the data on innovation are in line with, and do not contradict, the fundamental correlations between net fixed investment and GDP growth given above. The correlation between innovation and GDP growth was indirect. Therefore, large economies may have high levels of innovation but slow growth (Japan), low levels of innovation but fast GDP growth (India), or moderate levels of innovation but low GDP growth (Germany). In contrast, the correlation between the percentage of net fixed capital formation and GDP growth is direct and extremely high (0.95) for the world’s ten largest economies.
China’s lead in lead in the percentage of investment in GDP is why R&D and innovation can be much more rapidly turned into products in China than in the U.S. in many fields of new productive forces – as seen spectacularly, for example, in areas such as telecommunications, drones, green energy, and EVs. There is no reason to suppose that scientists and researchers in China and the U.S. differ in their intelligence or quality. However, the difference is that, in terms of net investment, behind Chinese research stands two dollars for every dollar in the U.S.. This gives China a decisive lead in the speed of turning innovation into products.
In summary, China faces two decisive challenges in strategic economic upgrading.
First, to further develop its percentage of R&D in GDP, to strengthen its innovation, in order to achieve the level of G7 economies that it still lags in this field – notably, the U.S., Japan, and Germany.
Second, China must maintain its lead in the percentage of net fixed capital formation in GDP, as this will determine the growth rate and long-term economic competition between China and the U.S..
The original Chinese version of this article was published at guancha.cn.